
The Data Scientist Interview: Designing an A/B Test for a Sign-Up Funnel
bugfree.ai is an advanced AI-powered platform designed to help software engineers master system design and behavioral interviews. Whether you’re preparing for your first interview or aiming to elevate your skills, bugfree.ai provides a robust toolkit tailored to your needs. Key Features:
150+ system design questions: Master challenges across all difficulty levels and problem types, including 30+ object-oriented design and 20+ machine learning design problems. Targeted practice: Sharpen your skills with focused exercises tailored to real-world interview scenarios. In-depth feedback: Get instant, detailed evaluations to refine your approach and level up your solutions. Expert guidance: Dive deep into walkthroughs of all system design solutions like design Twitter, TinyURL, and task schedulers. Learning materials: Access comprehensive guides, cheat sheets, and tutorials to deepen your understanding of system design concepts, from beginner to advanced. AI-powered mock interview: Practice in a realistic interview setting with AI-driven feedback to identify your strengths and areas for improvement.
bugfree.ai goes beyond traditional interview prep tools by combining a vast question library, detailed feedback, and interactive AI simulations. It’s the perfect platform to build confidence, hone your skills, and stand out in today’s competitive job market. Suitable for:
New graduates looking to crack their first system design interview. Experienced engineers seeking advanced practice and fine-tuning of skills. Career changers transitioning into technical roles with a need for structured learning and preparation.
Imagine you’re in a data science interview and you’re given this prompt:
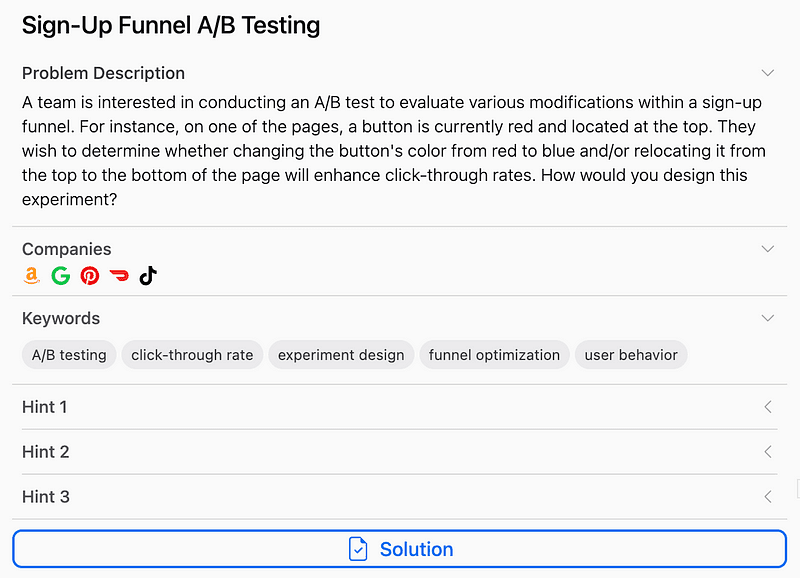
“A team wants to test whether changing a button’s color from red to blue and/or moving it from the top to the bottom of a page will improve click-through rates in a sign-up funnel. How would you design this experiment?”
This is more than a question about A/B testing. It’s an assessment of your ability to design an experiment under real-world constraints, reason through statistical choices, and understand system dynamics.
Here’s how to approach this methodically and with the level of technical depth expected in a senior data science or system design interview.
1. Define the Objective and Experimental Scope
Before designing anything, clarify the goal: the business wants to increase click-through rate (CTR) on a particular page in the sign-up funnel. The variables under consideration are:
- Button color: red vs. blue
- Button position: top vs. bottom
The outcome of interest is the click-through rate, defined as the number of users who clicked the button divided by the number who saw it.
At this stage, it’s important to also gather baseline metrics. For example, what is the current CTR, and how sensitive is the business to potential degradation in performance? Are there seasonal or traffic-driven variations in performance?
2. Design the Experiment Using a Factorial Framework
Since there are two independent binary variables (color and position), this is a classic 2x2 factorial design. This means there are four distinct variants to test:
- Red button at the top (control)
- Red button at the bottom
- Blue button at the top
- Blue button at the bottom
Using a factorial design allows you to isolate the main effects of each variable as well as their interaction. This is superior to running separate A/B tests for color and position because it captures how these factors might combine to produce a different outcome than when changed independently.
For instance, the blue button may perform better only when placed at the bottom — something you wouldn’t detect if you tested color and position in isolation.
3. Formulate Statistical Hypotheses
Each factor in the experiment has its own null and alternative hypotheses:
- Null hypothesis: Changing the button color or position has no effect on CTR.
- Alternative hypothesis: Changing the button color or position does affect CTR.
You also test for an interaction effect between the two variables. In this case, the null hypothesis is that the effect of one factor is independent of the level of the other factor.
4. Sample Size and Power Calculation
Statistical power is crucial to ensure that you can detect an effect if one truly exists. You typically set a significance level (alpha) of 0.05 and a power (1 — beta) of 0.8. These choices mean you are willing to accept a 5% chance of a false positive and a 20% chance of a false negative.
To determine the required sample size, you need to know:
- The baseline CTR (say, 20 percent)
- The minimum effect size you care about detecting (e.g., a 2 percentage point increase)
- Variance estimates based on historical data
Once you’ve specified these parameters, you use power analysis techniques to calculate the minimum number of users needed per variant. Remember that a factorial design with four variants means the total sample required will be four times the per-variant number.
5. Randomization and Exposure Management
Users should be randomly assigned to one of the four variants to ensure statistical validity. This prevents selection bias and ensures that the distribution of confounding variables (device type, geography, time of day) is balanced across all groups.
For consistency, implement deterministic bucketing based on user ID hashes. This ensures the same user always sees the same variant throughout the experiment, which is crucial in preserving experience integrity and proper attribution of outcomes.
Stratified randomization can be introduced if you expect strong segment-specific behavior, such as mobile versus desktop users.
6. Run the Experiment and Monitor Health Metrics
While CTR is the primary metric, monitor secondary metrics to ensure no adverse side effects. These may include bounce rate, funnel completion rate, or session time. Unexpected shifts in these metrics can indicate issues like user confusion or layout incompatibilities.
Make sure to run the experiment for a sufficient duration to capture behavior across different times of day and days of the week. This helps mitigate the effects of temporal variation and ensures your results generalize well.
7. Data Collection and Logging
You should log the following data points for each user:
- User identifier (hashed)
- Assigned variant
- Timestamp of page view
- Whether the button was clicked
- Any downstream conversions (optional but valuable)
Ensure logging is consistent and that data pipelines are validated before launching the experiment. Inconsistent logging can easily undermine the validity of your results.
8. Analyze the Results Using ANOVA
Since you are comparing more than two groups and interested in main and interaction effects, use a two-way Analysis of Variance (ANOVA).
This will tell you:
- Whether color alone has a statistically significant effect
- Whether position alone has a statistically significant effect
- Whether the combination (interaction) of color and position is significant
If ANOVA yields significant results, follow up with post-hoc tests to determine which specific combinations differ from each other. Adjust for multiple hypothesis testing using corrections such as Bonferroni or controlling the false discovery rate.
9. Interpret Behavioral Effects
Beyond statistical significance, consider behavioral dynamics that might influence interpretation:
- Novelty effect: Users may click more simply because the UI looks different. Consider whether performance is sustained over time.
- Change aversion: Conversely, some users may avoid the new design initially. Track trends over time to see if behavior normalizes.
These behavioral effects highlight the importance of monitoring how CTR evolves during the experiment, not just looking at the final snapshot.
10. Draw Conclusions and Recommend Action
Once analysis is complete, determine whether one or more variants lead to a statistically and practically significant increase in CTR. Make recommendations not only based on statistical outcomes but also on user experience and long-term business impact.
For example, if blue buttons at the bottom perform best, but cause a slight uptick in bounce rate, weigh that tradeoff carefully. You may also recommend running follow-up tests to isolate or mitigate any adverse effects.
Document all decisions, assumptions, and results thoroughly. A strong experiment is only as valuable as the clarity with which it can be communicated to stakeholders.
Final Thoughts
This experiment may sound simple, but it’s an excellent canvas to demonstrate deep technical thinking in a data science interview. Interviewers are often less interested in what tools you use, and more in how you reason about causality, handle noise and bias, design robust experiments, and draw valid conclusions from real-world behavior.
When approaching any product experiment, especially in a system design context, focus not just on metrics but on mechanisms. Show that you can think like a scientist embedded within a product team — methodical, rigorous, and outcome-driven.
If you’re preparing for interviews or want to sharpen your experimentation instincts, practice breaking down scenarios like this one and focus on the “why” behind every step you take.
Access full answer in bugfree.ai: https://bugfree.ai/data-question/funnel-ab-experiment


