High-score (Bugfree Users) Interview Experience — Pinterest Data Scientist Technical Round
I completed a 1-hour virtual technical round for a Data Scientist role at Pinterest. It was challenging, focused on practical problems, and split across three areas: SQL, Python, and experiment design. Below is a concise, actionable write-up with sample solutions, tips, and things to mention in an interview.
Highlights of the round
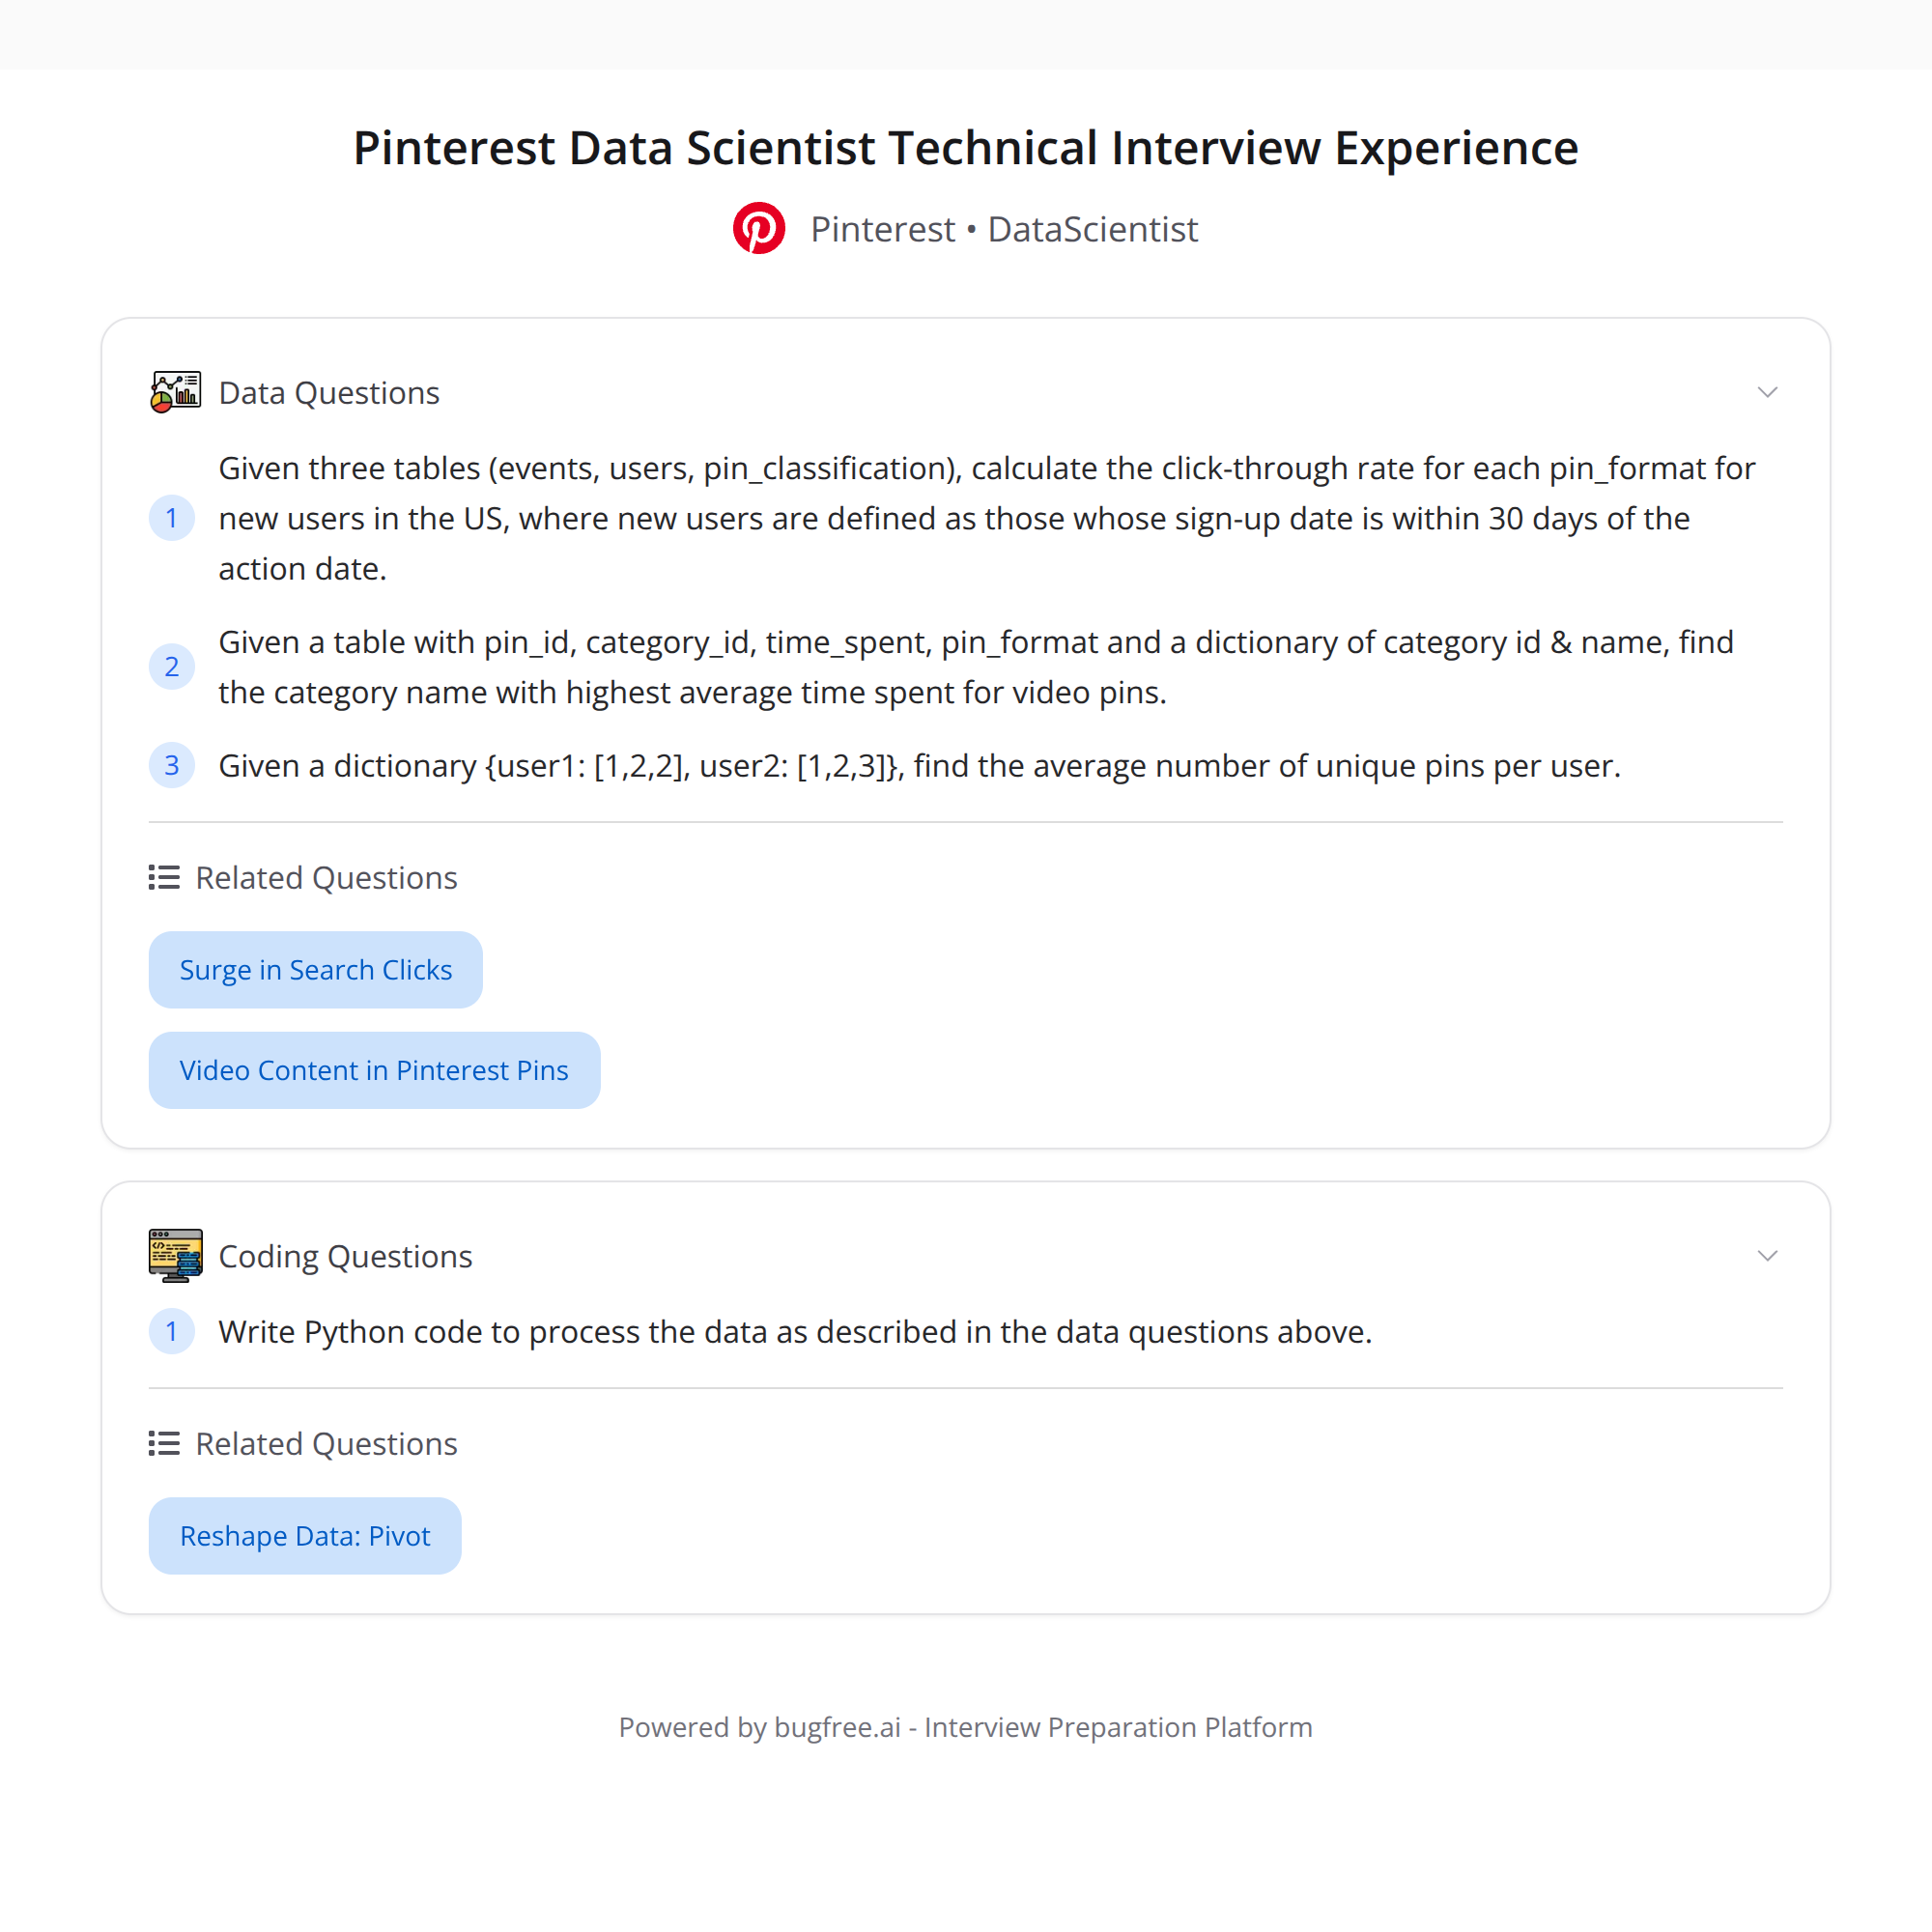
- SQL: Compute CTR by pin_format (video vs static) for new US users (where signup is within 30 days of the action date), using careful joins and filters across events, users, and pin_classification.
- Python: (1) Find the category with the highest average time_spent for video pins. (2) From a dict {user: [pins...]}, compute the average unique pins per user.
- Experiment design: State null and alternative hypotheses for boosting video pins; interpret a results table (key metrics, p-values) and discuss practical vs statistical significance.
Goal: For users who signed up within 30 days of the event date and are in the US, compute CTR (clicks / impressions) grouped by pin_format (video vs static).
Key considerations:
- Define "new user" relative to event date: event_date <= signup_date + 30 days and event_date >= signup_date.
- Only include users with country = 'US'.
- Join events -> users (to get signup/country) -> pin_classification (to get pin_format).
- Define which event types count as impressions vs clicks (e.g., 'impression' or 'view' vs 'click').
- Protect against division by zero and sparse data.
Sample SQL (ANSI / Postgres style):
WITH new_user_events AS (
SELECT
e.user_id,
e.event_date::date AS event_date,
pc.pin_format,
e.event_type
FROM events e
JOIN users u ON e.user_id = u.user_id
JOIN pin_classification pc ON e.pin_id = pc.pin_id
WHERE u.country = 'US'
AND e.event_date::date BETWEEN u.signup_date::date AND (u.signup_date::date + INTERVAL '30 days')
)
SELECT
pin_format,
SUM(CASE WHEN event_type = 'click' THEN 1 ELSE 0 END) AS clicks,
SUM(CASE WHEN event_type IN ('impression','view') THEN 1 ELSE 0 END) AS impressions,
CASE WHEN SUM(CASE WHEN event_type IN ('impression','view') THEN 1 ELSE 0 END) = 0
THEN NULL
ELSE ROUND(100.0 * SUM(CASE WHEN event_type = 'click' THEN 1 ELSE 0 END)
/ SUM(CASE WHEN event_type IN ('impression','view') THEN 1 ELSE 0 END), 4)
END AS ctr_percent
FROM new_user_events
GROUP BY pin_format
ORDER BY pin_format;
Notes to discuss in interview:
- Clarify event_type semantics and which events count as impressions.
- If impressions are logged separately, use that table instead of relying on event_type.
- Consider deduping (e.g., unique (user, pin, date)) if multiple impressions should be collapsed.
- Discuss how to treat NULL pin_format and low-volume groups.
2) Python tasks
Two short tasks often used to test data manipulation and thinking.
Task A — Find category with highest average time_spent for video pins
Assume a DataFrame df with columns: pin_id, pin_format, category, time_spent.
Pandas solution:
import pandas as pd
video = df[df['pin_format'] == 'video']
category_avg = video.groupby('category', as_index=False)['time_spent'].mean()
top = category_avg.sort_values('time_spent', ascending=False).head(1)
print(top)
Alternatively, one-liner:
top_category = video.groupby('category')['time_spent'].mean().idxmax()
Task B — Given {user: [pins...]}, compute average unique pins per user
Given a dict user_pins where keys are user ids and values are lists of pin ids:
user_pins = {
    'u1': ['p1','p1','p2'],
    'u2': ['p2','p3'],
    'u3': []
}

import numpy as np

unique_counts = [len(set(pins)) for pins in user_pins.values()]
avg_unique_per_user = np.mean(unique_counts)
print(avg_unique_per_user)
One-liner:
avg_unique = sum(len(set(p)) for p in user_pins.values()) / max(1, len(user_pins))
Interview tips for Python problems:
- Mention edge cases (empty lists, missing keys, None values).
- Discuss complexity: using set() is O(n) per user; fine for modest sizes.
- If data is huge, propose streaming or using groupby in a DB.
3) Experiment design: boosting video pins
This part tests your ability to structure an A/B test, choose metrics, and interpret results.
Example framing:
- Objective: Determine whether boosting video pins increases engagement (e.g., CTR, time_spent, saves, or watch-through rate).
Hypotheses:
- Null hypothesis (H0): The treatment (boosting video pins) does not change the metric versus control.
- Alternative hypothesis (H1): The treatment increases the metric (one-sided), or simply changes it (two-sided).
Key metrics to track:
- Primary: engagement metric aligned with product goal (e.g., CTR for pins, watch-through for videos, average time_spent).
- Secondary: saves, repins, retention (DAU/WAU), session length.
- Safety metrics: load times, crash rates, downstream metrics (ad revenue) to catch regressions.
Interpreting a results table: columns you might see: metric, control_mean, treatment_mean, delta, std_err, p_value, lift%
How to interpret p-values and results:
- p-value < alpha (commonly 0.05) means reject H0 (statistically significant). If p >= alpha, do not reject H0.
- Statistical significance ≠ practical significance. Check absolute lift and confidence intervals.
- Report effect sizes and confidence intervals; a tiny lift with low p-value may be irrelevant.
- Check directionality: if you used a one-sided test, interpret p-values appropriately.
- Run sanity checks: sample sizes match expected assignment split, baseline metrics are balanced, experiment duration covers weekday/weekend patterns.
Other considerations:
- Power & sample size: compute required sample to detect minimum detectable effect (MDE) at desired power (usually 80-90%).
- Multiple comparisons: if you check many metrics, correct for multiple testing (e.g., Bonferroni, control FDR) or pre-register the primary metric.
- Heterogeneous treatment effects: consider segmenting by cohort (new vs existing users), location, device, or activity level.
- Duration & novelty: avoid too-short experiments or transient novelty effects. Ensure at least one full business cycle.
Quick checklist to mention in interview:
- Define primary metric and rationale.
- State H0/H1 and whether test is one- or two-sided.
- Show sample size & MDE calculations and expected power.
- List basic sanity checks (randomization, sample balance, no instrumentation errors).
- Plan analysis: pre-specified look, adjustments, and metrics to gate launch.
Practical takeaways & interview tips
- Talk through assumptions explicitly (event semantics, deduping, what counts as new user).
- Ask clarifying questions before coding; interviewers expect this.
- Write readable SQL/py snippets and explain edge cases and performance considerations.
- When interpreting experiments, always separate statistical from practical significance and discuss tradeoffs.
- If time is limited, present a clear plan/pseudocode rather than perfect implementation.
If you want, I can:
- Provide a fully annotated SQL query adapted to your specific schema.
- Expand the experiment-design section with sample power calculations.
- Convert the Python snippets into full functions and add unit tests.
#DataScience #SQL #ABTesting #Python