
System Design Interviews: If You Don’t Build Observability, You’re Designing Blind

bugfree.ai is an advanced AI-powered platform designed to help software engineers master system design and behavioral interviews. Whether you’re preparing for your first interview or aiming to elevate your skills, bugfree.ai provides a robust toolkit tailored to your needs. Key Features:
150+ system design questions: Master challenges across all difficulty levels and problem types, including 30+ object-oriented design and 20+ machine learning design problems. Targeted practice: Sharpen your skills with focused exercises tailored to real-world interview scenarios. In-depth feedback: Get instant, detailed evaluations to refine your approach and level up your solutions. Expert guidance: Dive deep into walkthroughs of all system design solutions like design Twitter, TinyURL, and task schedulers. Learning materials: Access comprehensive guides, cheat sheets, and tutorials to deepen your understanding of system design concepts, from beginner to advanced. AI-powered mock interview: Practice in a realistic interview setting with AI-driven feedback to identify your strengths and areas for improvement.
bugfree.ai goes beyond traditional interview prep tools by combining a vast question library, detailed feedback, and interactive AI simulations. It’s the perfect platform to build confidence, hone your skills, and stand out in today’s competitive job market. Suitable for:
New graduates looking to crack their first system design interview. Experienced engineers seeking advanced practice and fine-tuning of skills. Career changers transitioning into technical roles with a need for structured learning and preparation.
System Design Interviews: If You Don’t Build Observability, You’re Designing Blind
Observability is the ability to infer a system’s internal state from the signals it emits. In system design interviews it’s not enough to draw boxes and arrows — you must also explain how you’ll monitor, debug, and operate the system under real-world conditions.
Below is a condensed, interview-friendly guide to the three pillars of observability and practical rules you can state and apply during a design discussion.
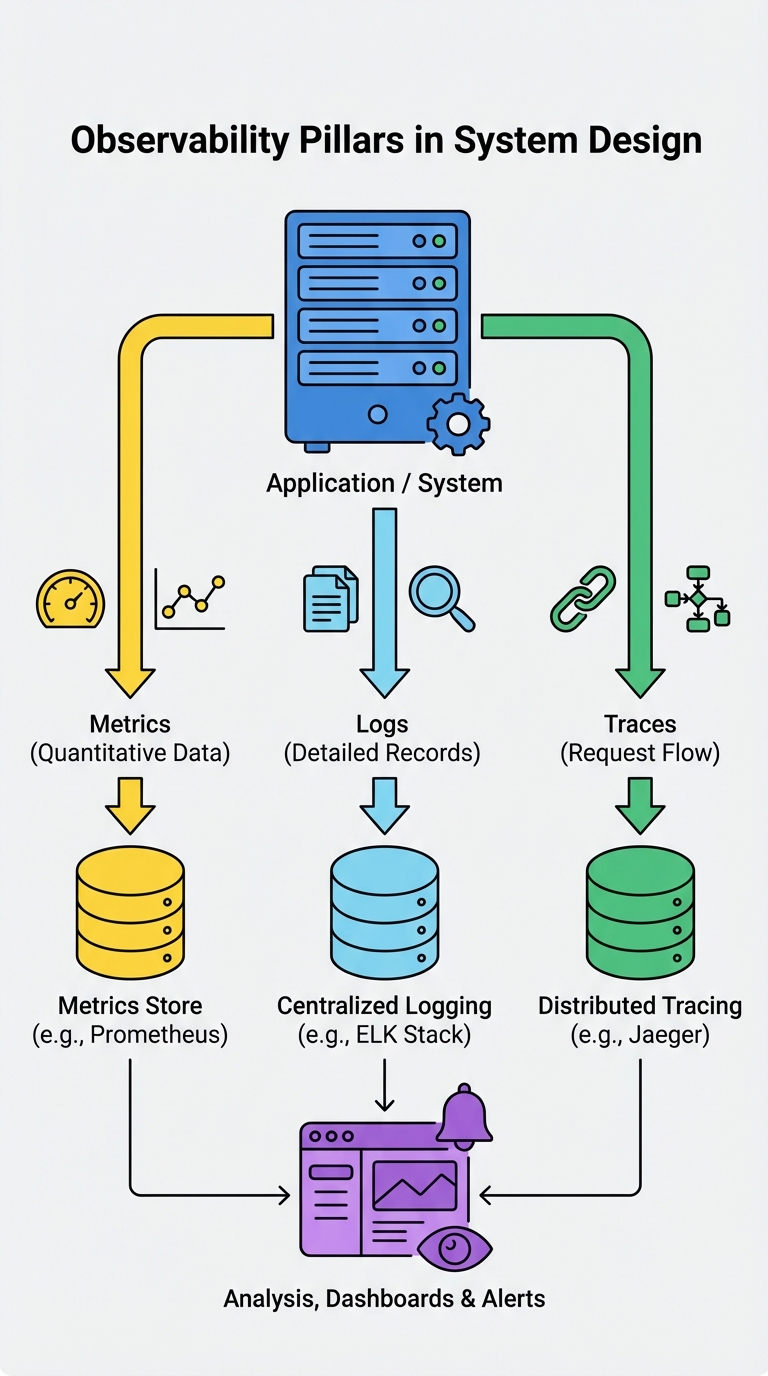
The three pillars of observability
Metrics — high-level numeric indicators of system health. Focus on latency (p50/p95/p99), error rates, and saturation (CPU, memory, queue depth). Metrics are for alerts and SLIs/SLOs.
Logs — structured, event-level records used for root-cause analysis. Emit contextual fields like
request_id,user_id,handler,error_code, and timestamps. Logs help reconstruct what happened when a metric or trace flags a problem.Traces — distributed traces follow a request through services to show the end-to-end flow and timing. Use trace IDs propagated across RPCs to pinpoint slow hops and bottlenecks.
Design rules to mention (and why)
Instrument by default
- Assume every new service/component emits metrics, logs, and traces. Default instrumentation prevents observability debt.
Centralize logs and metrics
- Ship logs to a centralized store (e.g., ELK, Loki) and metrics to a time-series DB (Prometheus, Cortex). Centralization makes correlation and alerting possible.
Standardize metrics and log formats
- Use consistent names, units, and label conventions (e.g.,
service,endpoint,region). Structured logs (JSON) simplify querying and linking to traces.
- Use consistent names, units, and label conventions (e.g.,
Add distributed tracing
- Propagate a trace/context ID, instrument entry and exit points, and capture timing for RPCs, DB calls, and queues.
Ship dashboards and alerts
- Dashboards for SLOs and system health; alerts for actionable thresholds (avoid noisy alerts). Define runbooks for common failures.
Review and iterate
- Treat observability as code: add instrumentation when debugging, refine dashboards, and improve SLOs based on incidents.
Interview checklist — quick things to say
- "We’ll emit
http_request_duration_secondshistograms and p99 latency SLOs for critical endpoints." - "All requests include a
trace_idandrequest_idfor correlation." - "Structured logs go to a centralized log store and are retained for X days; critical logs have longer retention."
- "We’ll create alerts for error rate (>1% for 5m) and queue depth higher than threshold."
- "Use sampling for high-volume traces but keep 100% sampling for errors or flagged requests."
Saying these lines during an interview demonstrates you can design for operability, not just functionality.
Short examples (what to instrument)
- Frontend/API gateway: request count, latency histograms, 4xx/5xx rates, incoming size distribution.
- Backend services: DB query latency, cache hit ratio, worker queue depth, CPU usage.
- Messaging/queues: publish/consume rates, processing duration, dead-letter counts.
Final tip
Observability is the difference between a system you can operate and one you only hope will work. In interviews, explicitly map each component to metrics, logs, and traces, and mention dashboards, alerts, and runbooks. Design for debuggability — not doing so is designing blind.
#SystemDesign #Observability #SRE #DistributedSystems #Microservices #SoftwareEngineering #TechInterviews

