
Pizza Order No‑Shows: Stop Chasing Accuracy—Pick the Right Metric

bugfree.ai is an advanced AI-powered platform designed to help software engineers master system design and behavioral interviews. Whether you’re preparing for your first interview or aiming to elevate your skills, bugfree.ai provides a robust toolkit tailored to your needs. Key Features:
150+ system design questions: Master challenges across all difficulty levels and problem types, including 30+ object-oriented design and 20+ machine learning design problems. Targeted practice: Sharpen your skills with focused exercises tailored to real-world interview scenarios. In-depth feedback: Get instant, detailed evaluations to refine your approach and level up your solutions. Expert guidance: Dive deep into walkthroughs of all system design solutions like design Twitter, TinyURL, and task schedulers. Learning materials: Access comprehensive guides, cheat sheets, and tutorials to deepen your understanding of system design concepts, from beginner to advanced. AI-powered mock interview: Practice in a realistic interview setting with AI-driven feedback to identify your strengths and areas for improvement.
bugfree.ai goes beyond traditional interview prep tools by combining a vast question library, detailed feedback, and interactive AI simulations. It’s the perfect platform to build confidence, hone your skills, and stand out in today’s competitive job market. Suitable for:
New graduates looking to crack their first system design interview. Experienced engineers seeking advanced practice and fine-tuning of skills. Career changers transitioning into technical roles with a need for structured learning and preparation.
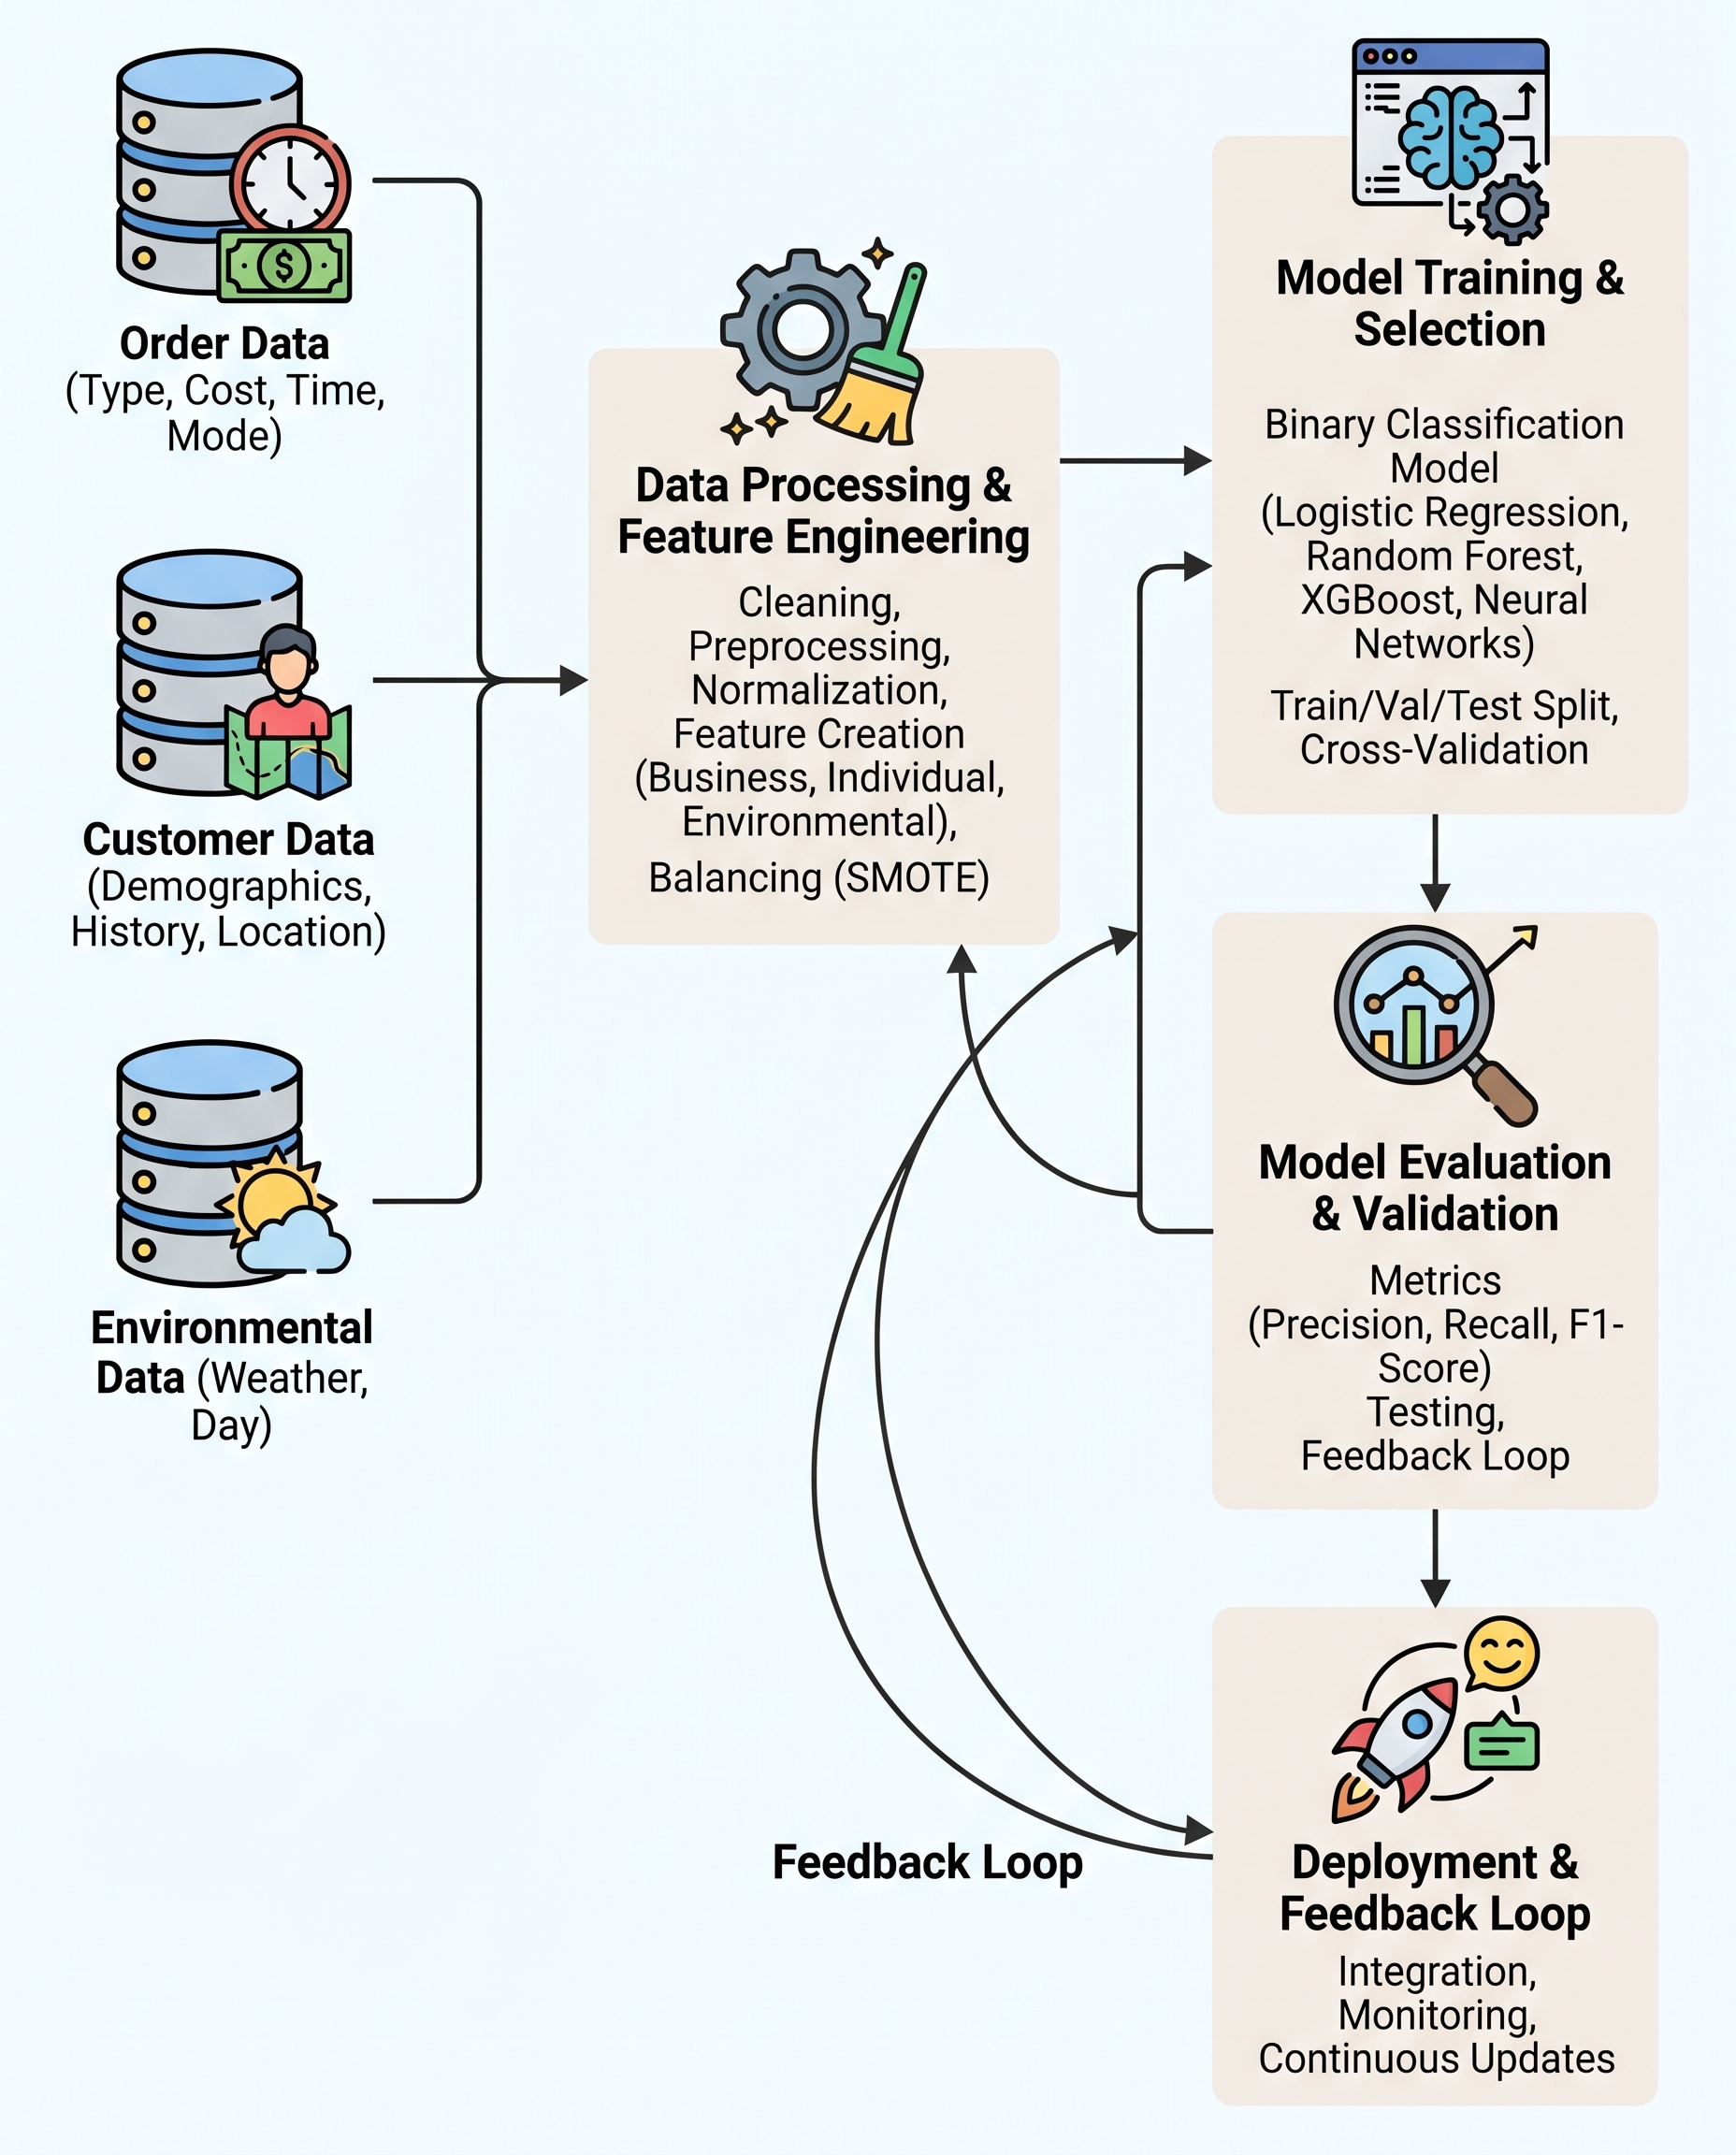
Pizza order no-shows: why accuracy misleads and what to measure instead
When predicting pizza order no-shows, accuracy is a trap. Real-world order data is usually imbalanced: most customers show up. A model that always predicts "show" can still report very high accuracy while being useless for business decisions.
Instead of a single accuracy score, pick the metric that reflects the business cost of different errors. Below is a concise guide to choosing and validating the right metric.
Quick refresher: confusion matrix and key metrics
- True Positive (TP): predicted no-show and it was a no-show
- False Positive (FP): predicted no-show but customer showed up
- False Negative (FN): predicted show but customer no-showed
- True Negative (TN): predicted show and customer showed up
From these:
- Precision = TP / (TP + FP) — of predicted no-shows, how many are actual no-shows
- Recall = TP / (TP + FN) — of all actual no-shows, how many did we catch
- Accuracy = (TP + TN) / (TP + FP + FN + TN) — sensitive to class balance
Example (1000 orders, 100 actual no-shows):
- A dumb model predicts everyone will show → Accuracy = 900/1000 = 90%, Recall = 0% (it never detects a no-show) — useless despite high accuracy.
Which metric should you prioritize?
Prioritize precision when acting on a "no-show" prediction triggers costly operations: extra staffing, remaking pizzas, holding inventory, or idling drivers. A low-precision model will create many false alarms and drive those costs up.
Prioritize recall when missing a no-show is more expensive than a false alarm. For example, if failing to predict a no-show causes serious customer dissatisfaction, penalties, or wasted resources that are larger than the cost of occasional false alarms.
Often you’ll need a balanced view: measure both, but optimize the one aligned with business impact.
How to validate — don’t rely on a single scalar
- Confusion matrix: always report it for your chosen threshold so stakeholders see TP/FP/FN/TN counts.
- Precision–Recall (PR) curve: with class imbalance, PR curves show trade-offs more clearly than ROC. Use PR AUC to compare models when positive class (no-shows) is rare.
- Threshold tuning: choose an operating threshold based on expected monetary cost (or a loss matrix) rather than default 0.5. Find the threshold that minimizes expected cost = FP_cost FP + FN_cost FN.
- Calibration: ensure predicted probabilities are well-calibrated if you want to use them to make threshold decisions.
- Monitor in production: class balance and costs can drift (promos, seasons). Re-evaluate the operating point regularly.
Practical workflow
- Quantify business costs of FP and FN (and any costs for TP/TN if applicable).
- Select primary metric (precision or recall) and secondary metrics (F1, PR AUC, confusion matrix).
- Train models with class weighting, sampling, or cost-sensitive objectives if needed.
- Use validation PR curves and cost-based thresholding to pick the operating point.
- Validate with confusion matrices and example cases. Deploy with monitoring and alerts for drift.
Short checklist for interviews or reports
- State the business cost matrix up front.
- Explain why accuracy is misleading with imbalanced data.
- Declare the primary metric (precision or recall) and why.
- Show the confusion matrix at your chosen threshold and a PR curve.
- Describe thresholding and calibration decisions.
Choosing the right metric ties your model evaluation to real business outcomes. Don’t chase accuracy—optimize for what actually matters.
#MachineLearning #DataScience #MLOps

