
High-Score (Bugfree Users) Interview Experience: Pinterest Data Scientist Technical Round — SQL + Python + Experiment Design
bugfree.ai is an advanced AI-powered platform designed to help software engineers master system design and behavioral interviews. Whether you’re preparing for your first interview or aiming to elevate your skills, bugfree.ai provides a robust toolkit tailored to your needs. Key Features:
150+ system design questions: Master challenges across all difficulty levels and problem types, including 30+ object-oriented design and 20+ machine learning design problems. Targeted practice: Sharpen your skills with focused exercises tailored to real-world interview scenarios. In-depth feedback: Get instant, detailed evaluations to refine your approach and level up your solutions. Expert guidance: Dive deep into walkthroughs of all system design solutions like design Twitter, TinyURL, and task schedulers. Learning materials: Access comprehensive guides, cheat sheets, and tutorials to deepen your understanding of system design concepts, from beginner to advanced. AI-powered mock interview: Practice in a realistic interview setting with AI-driven feedback to identify your strengths and areas for improvement.
bugfree.ai goes beyond traditional interview prep tools by combining a vast question library, detailed feedback, and interactive AI simulations. It’s the perfect platform to build confidence, hone your skills, and stand out in today’s competitive job market. Suitable for:
New graduates looking to crack their first system design interview. Experienced engineers seeking advanced practice and fine-tuning of skills. Career changers transitioning into technical roles with a need for structured learning and preparation.
High-Score Interview: Pinterest Data Scientist Technical Round — SQL, Python & Experiment Design
I recently completed a 1-hour virtual technical round for a Data Scientist role at Pinterest. The interview was short, practical, and challenging — focused on SQL joins and filters, Python pandas manipulation, and A/B experiment design/interpretation. Below I rephrase and expand the prompts and include concise solutions, assumptions, and tips.
Quick highlights
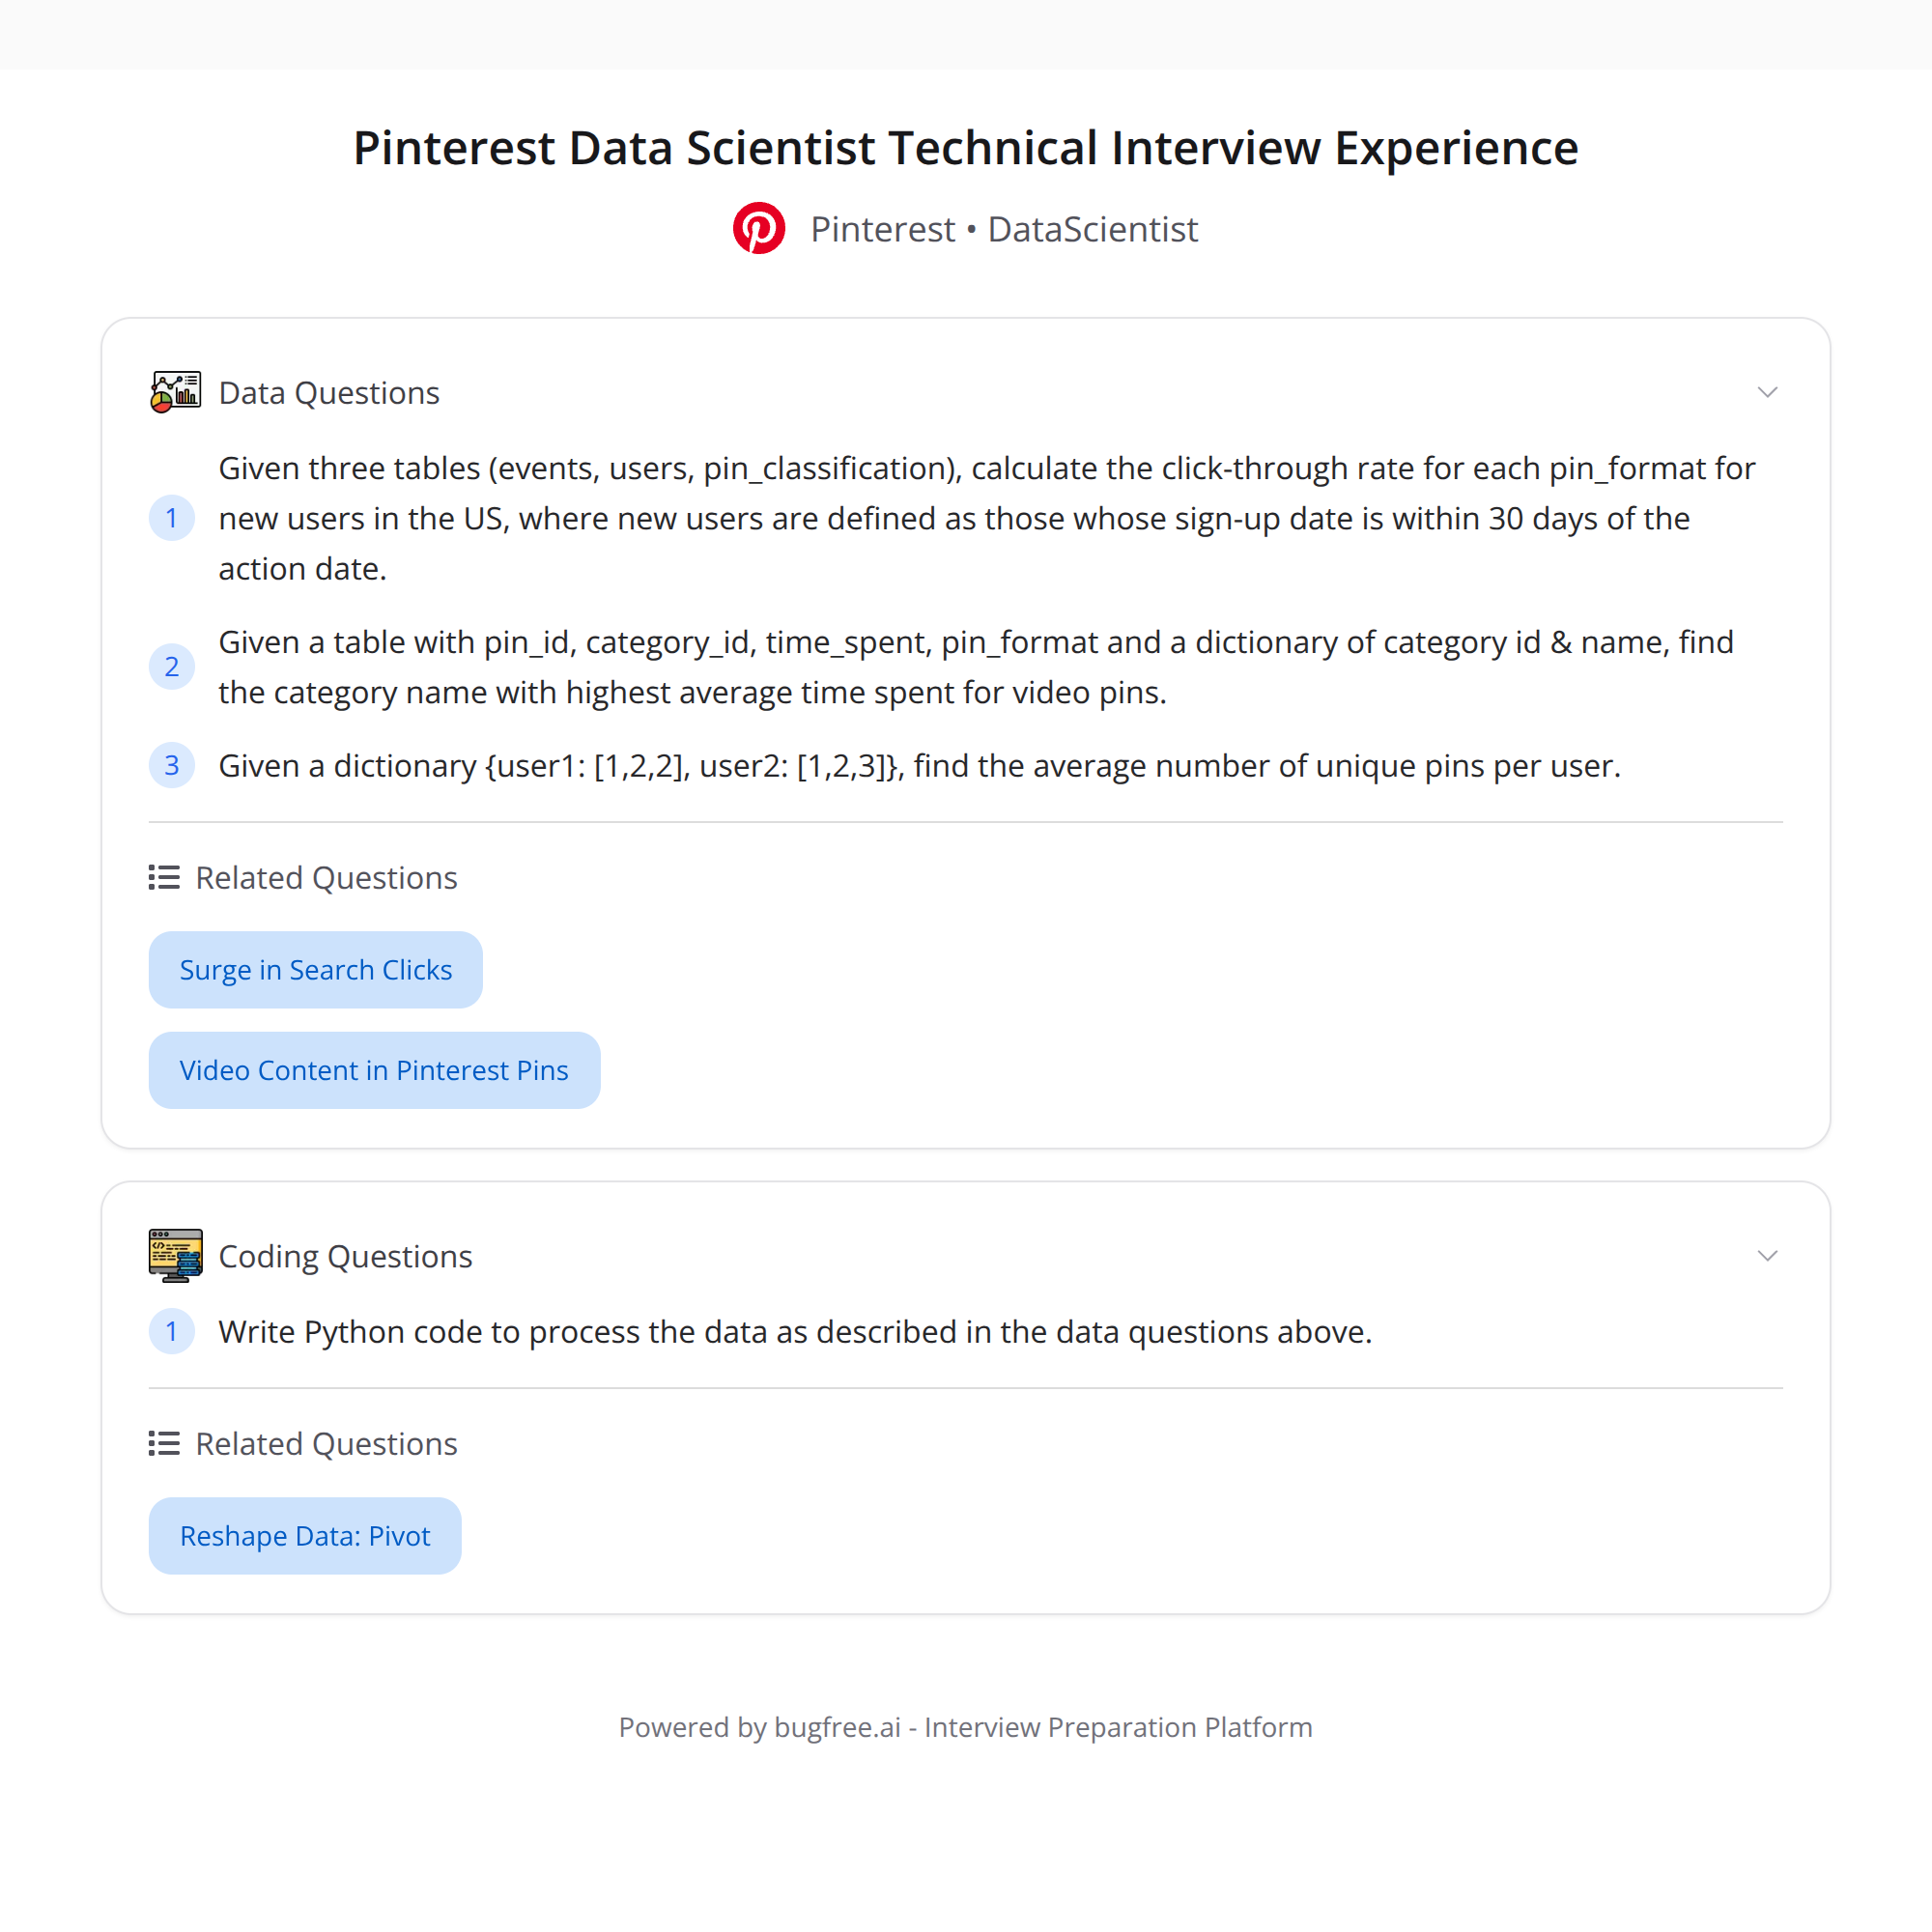
- SQL: Compute CTR by pin_format (video vs static) for new US users (signup within 30 days of the action date). Requires careful joins/filters across events, users, and pin_classification.
- Python: (1) Find the category name with the highest average time_spent for video pins. (2) From a mapping {user: [pins...]}, compute the average number of unique pins per user.
- Experiment design: Formulate hypotheses for boosting video pins, interpret a result table (key metrics & p-values), and explain what conclusions you can draw.
1) SQL challenge — compute CTR by pin_format for new US users
Goal: For each pin_format (video, static), compute Click-Through Rate (CTR) among users from the US whose signup date is within 30 days prior to the event date.
Assumptions (adjust to your schema):
- events table has rows with event_type (e.g., 'impression', 'click'), pin_id, user_id, event_date.
- users table has user_id, country, signup_date.
- pin_classification has pin_id, pin_format (e.g., 'video' or 'static').
- CTR = clicks / impressions.
Pattern: join events -> users (to filter new US users) -> pin_classification (to get format), then aggregate with conditional counts.
Sample SQL (ANSI-style, adapt column/table names to your DB):
WITH filtered_events AS (
  SELECT
    e.user_id,
    e.pin_id,
    e.event_type,
    e.event_date
  FROM events e
  JOIN users u ON u.user_id = e.user_id
  WHERE u.country = 'US'
    -- user is new relative to event date (signup within 30 days before event)
    AND DATE_DIFF(day, u.signup_date, e.event_date) BETWEEN 0 AND 30
)

SELECT
  pc.pin_format,
  SUM(CASE WHEN fe.event_type = 'click' THEN 1 ELSE 0 END) AS clicks,
  SUM(CASE WHEN fe.event_type = 'impression' THEN 1 ELSE 0 END) AS impressions,
  CASE WHEN SUM(CASE WHEN fe.event_type = 'impression' THEN 1 ELSE 0 END) = 0
       THEN NULL
       ELSE 1.0 * SUM(CASE WHEN fe.event_type = 'click' THEN 1 ELSE 0 END)
            / SUM(CASE WHEN fe.event_type = 'impression' THEN 1 ELSE 0 END)
  END AS ctr
FROM filtered_events fe
JOIN pin_classification pc ON pc.pin_id = fe.pin_id
GROUP BY pc.pin_format
ORDER BY pc.pin_format;
Notes/tips:
- Use DATE arithmetic appropriate to your SQL dialect (DATE_DIFF, TIMESTAMPDIFF, or date arithmetic).
- If events have multiple rows per impression (e.g., views vs served), clarify the event_type definition.
- Consider deduplicating impressions if the same impression is logged multiple times.
2) Python tasks (pandas and dict manipulations)
Task A: Find the category with the highest average time_spent for video pins.
Assumptions:
- You have a dataframe
pinswith columns: pin_id, pin_format (e.g., 'video'), category_name. - You have engagement or session data
engagementwith pin_id and time_spent (numeric seconds).
Pandas approach (concise):
# filter to video pins
video_pins = pins[pins['pin_format'] == 'video'][['pin_id', 'category_name']]

# join engagement
merged = engagement.merge(video_pins, on='pin_id', how='inner')

# compute avg time spent per category
category_avg = merged.groupby('category_name')['time_spent'].mean().reset_index()

# pick highest
top = category_avg.sort_values('time_spent', ascending=False).iloc[0]
print(top['category_name'], top['time_spent'])
Notes:
- If time_spent is skewed, consider median or robust mean.
- Ensure you handle outliers (e.g., extremely long sessions) or sessions with missing durations.
Task B: From a dict mapping {user: [pins...]}, compute the average number of unique pins per user.
Python one-liner and explanation:
# example: user_pins = {'u1': ['p1','p2','p1'], 'u2': ['p3']}
avg_unique = sum(len(set(v)) for v in user_pins.values()) / len(user_pins)
This computes the unique pin count per user (deduplicating with set) then takes the mean across users.
3) Experiment design & result interpretation
Prompt: You propose boosting video pins; design hypothesis vs alternative, interpret a results table with key metrics and p-values.
Framing the experiment
- Objective: Test whether boosting video pins increases a primary business metric (e.g., CTR, time_spent, or conversions).
Hypotheses (example using CTR as primary metric):
- Null hypothesis (H0): Boosting video pins does not change CTR (CTR_treatment = CTR_control).
- Alternative hypothesis (H1): Boosting video pins changes CTR (CTR_treatment != CTR_control). Use one-sided (>) if you only care about increase.
Design considerations:
- Randomization unit: user-level randomization usually avoids cross-user contamination. Pin-level or session-level possible but watch interference.
- Primary metric: choose one primary metric (CTR, average time_spent, or downstream conversion). Decide guardrail metrics (e.g., negative impact on retention, quality metrics, or revenue).
- Power & sample size: compute required sample size using baseline rate, minimum detectable effect (MDE), desired power (e.g., 80%), and alpha (e.g., 0.05).
- Duration: run long enough to capture user behavior cycles (daily/weekly) and achieve required sample size.
- Stop rules: pre-specify analysis plan; avoid peeking or apply alpha-spending correction.
Interpreting results and p-values
- A p-value below alpha (e.g., 0.05) suggests evidence against H0 in favor of H1.
- A non-significant p-value doesn't prove H0; it means data were insufficient to reject H0 at the chosen alpha and power.
- Report effect sizes (absolute and relative lift) with confidence intervals — these are more actionable than p-values alone.
- Check practical significance: a statistically significant small lift might not be worth product/engineering cost.
- Examine guardrail metrics: ensure no adverse effects on retention, revenue, or other KPIs.
Example checklist when interpreting a results table:
- Primary metric: treatment CTR, control CTR, absolute lift, relative lift, 95% CI, p-value.
- Sample sizes and denominators: unique users, impressions, clicks.
- Diagnostics: randomization balance, baseline covariates, metric distribution, and possible violations (e.g., non-independence).
- Heterogeneous effects: check by segment (country, new vs existing users).
Common statistical tests
- CTR (proportion): two-proportion z-test or chi-square test; you can also use bootstrap for robust CIs.
- Time_spent (continuous, skewed): use log-transformed t-test, Mann-Whitney, or bootstrap for mean/median difference.
How to report a clear conclusion
- State primary metric and whether it passed the pre-specified threshold for significance.
- Provide effect size and CI, comment on business impact.
- Mention guardrails and segment-level findings.
- Recommend next steps: rollout, further segmentation, or iterative experiments.
Final tips for interviews
- State your assumptions explicitly (schema, definitions like CTR). Interviewers value clarity.
- Talk through edge cases: duplicate events, missing users, timezone issues for date windows.
- For SQL, explain join order and why filtering early improves performance.
- For Python/pandas, mention memory considerations and alternatives for very large datasets (dask, pyspark).
- For experiments, be crisp: define metric, hypothesis, randomization unit, required sample size, and decision criteria.
If you'd like, I can:
- Provide a fully worked SQL query tailored to your schema.
- Expand Python examples with real toy data.
- Run through an example A/B result table and show exact statistical calculations.
#DataScience #SQL #ABTesting #Python

