
Your OOD Diagram Isn’t “Good” Unless It’s Readable in 60 Seconds
bugfree.ai is an advanced AI-powered platform designed to help software engineers master system design and behavioral interviews. Whether you’re preparing for your first interview or aiming to elevate your skills, bugfree.ai provides a robust toolkit tailored to your needs. Key Features:
150+ system design questions: Master challenges across all difficulty levels and problem types, including 30+ object-oriented design and 20+ machine learning design problems. Targeted practice: Sharpen your skills with focused exercises tailored to real-world interview scenarios. In-depth feedback: Get instant, detailed evaluations to refine your approach and level up your solutions. Expert guidance: Dive deep into walkthroughs of all system design solutions like design Twitter, TinyURL, and task schedulers. Learning materials: Access comprehensive guides, cheat sheets, and tutorials to deepen your understanding of system design concepts, from beginner to advanced. AI-powered mock interview: Practice in a realistic interview setting with AI-driven feedback to identify your strengths and areas for improvement.
bugfree.ai goes beyond traditional interview prep tools by combining a vast question library, detailed feedback, and interactive AI simulations. It’s the perfect platform to build confidence, hone your skills, and stand out in today’s competitive job market. Suitable for:
New graduates looking to crack their first system design interview. Experienced engineers seeking advanced practice and fine-tuning of skills. Career changers transitioning into technical roles with a need for structured learning and preparation.
Your OOD Diagram Isn’t “Good” Unless It’s Readable in 60 Seconds
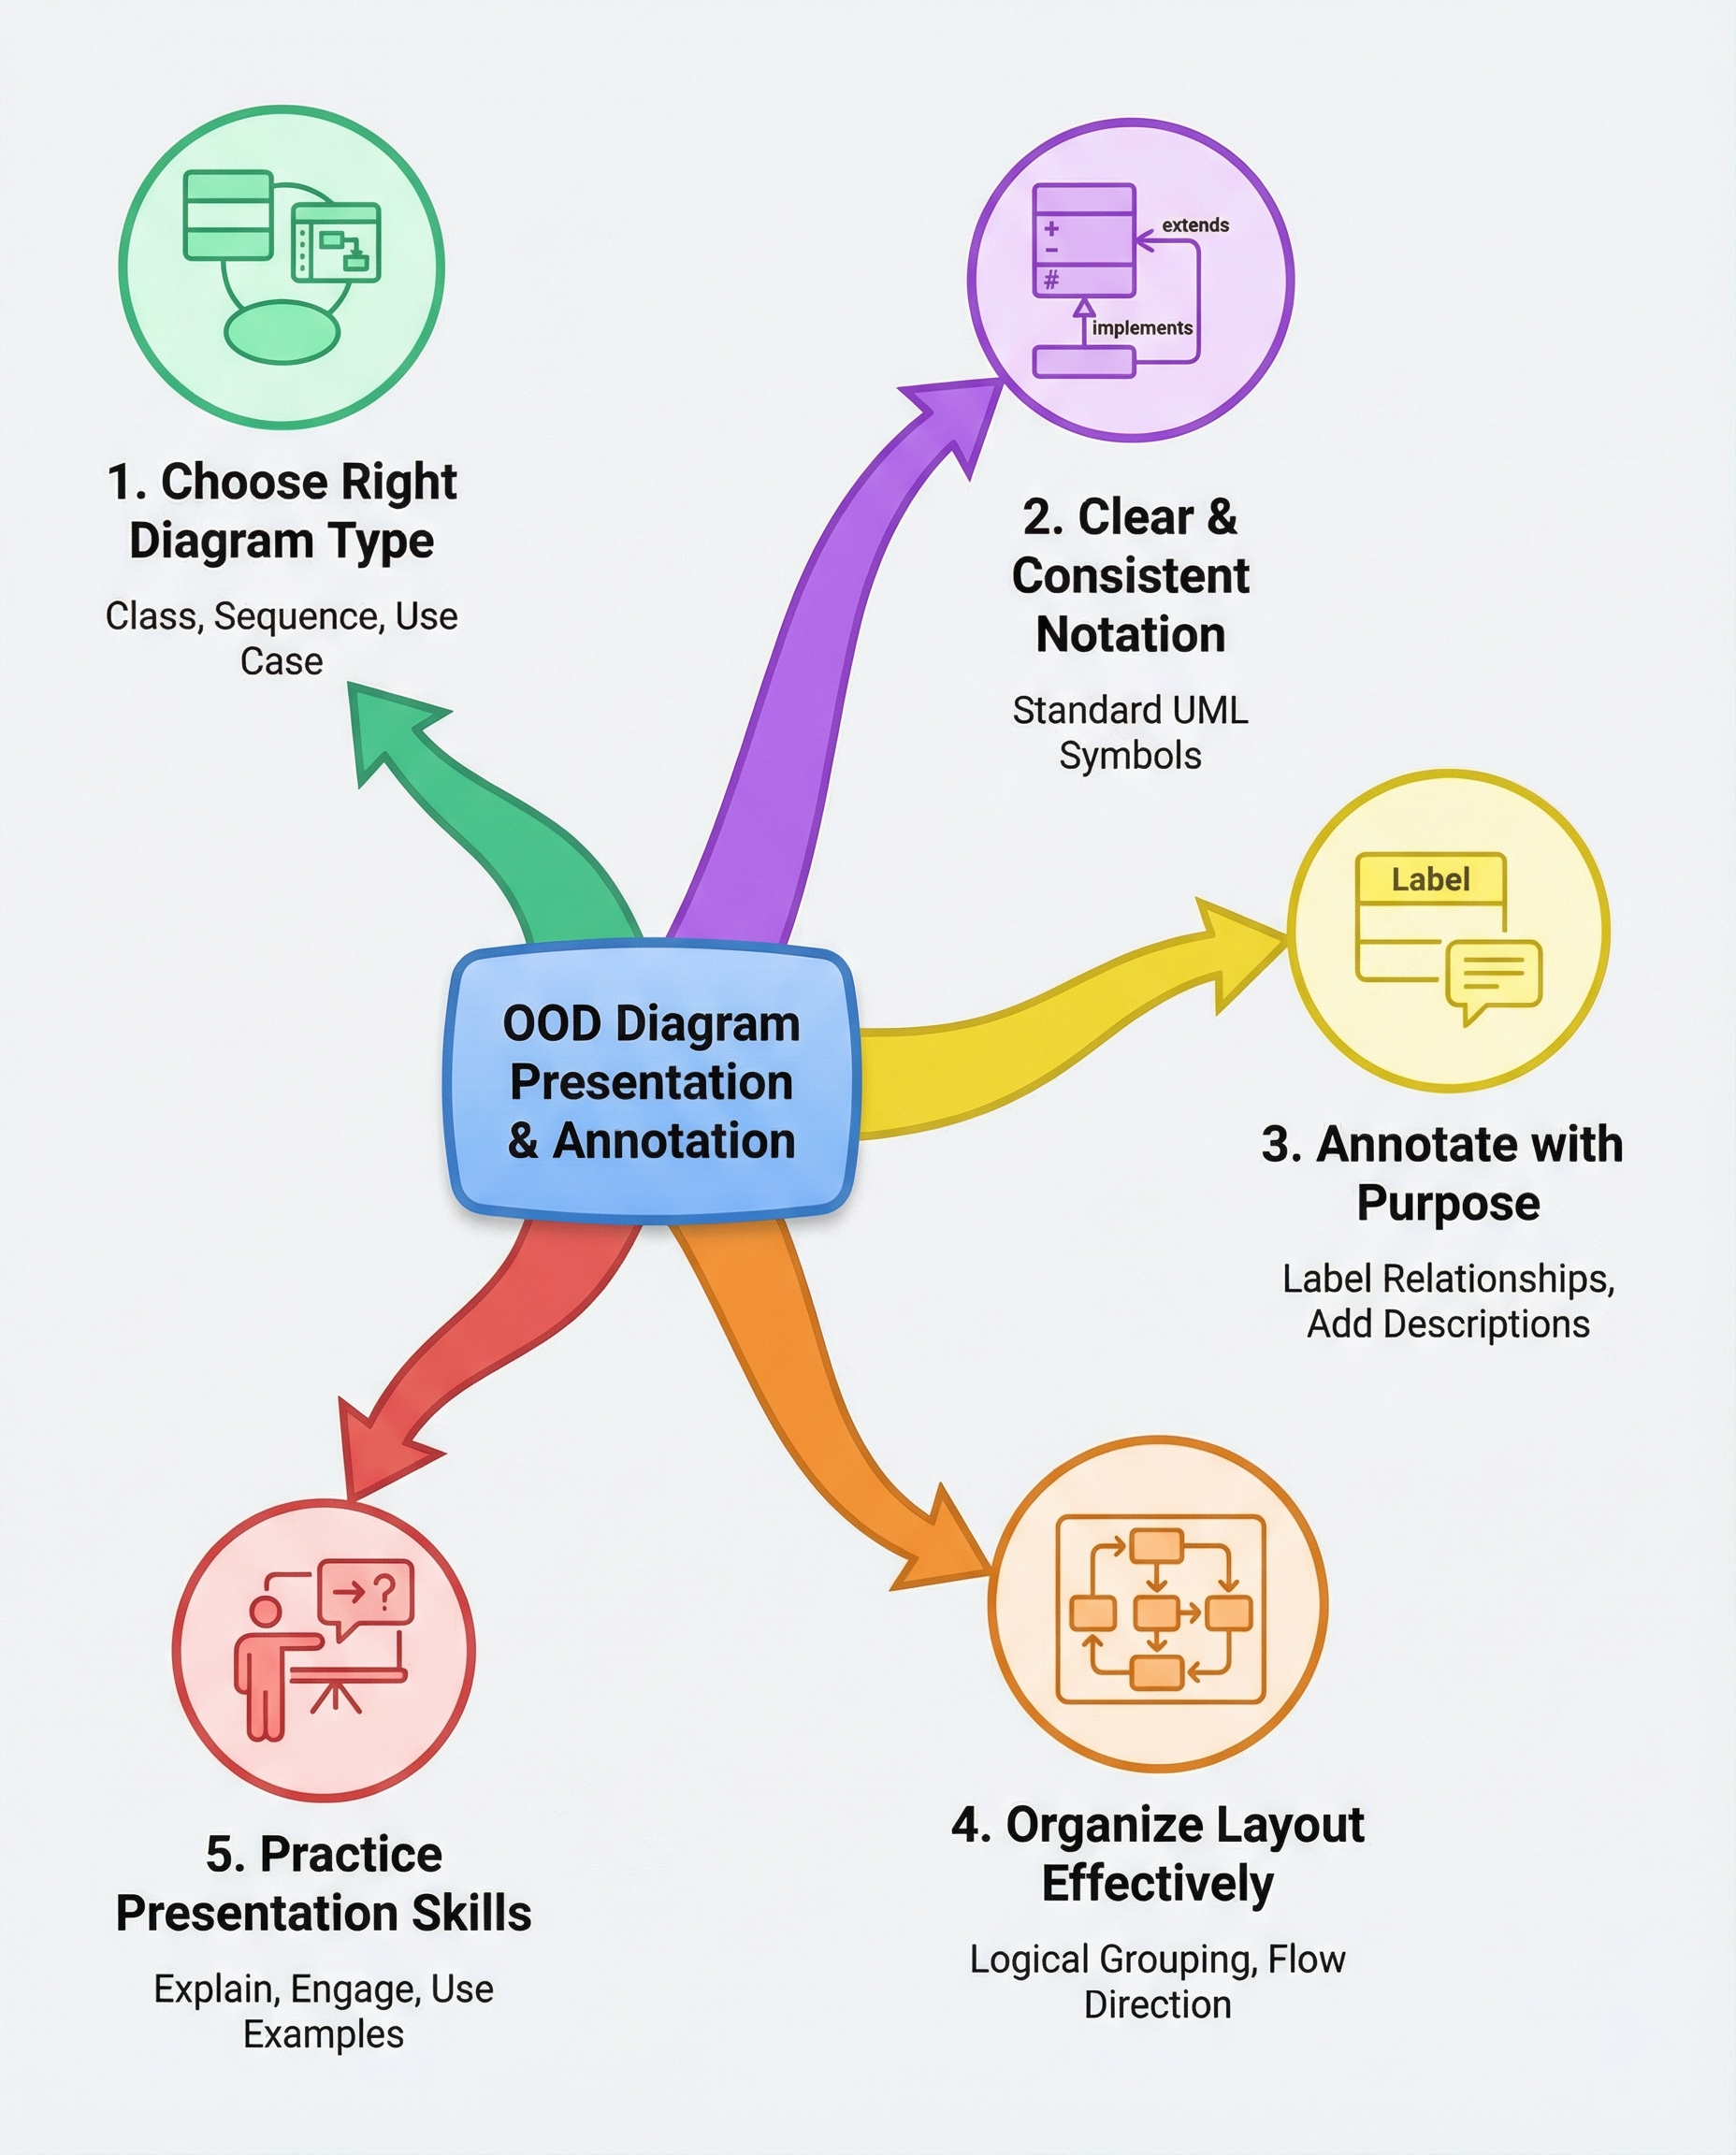
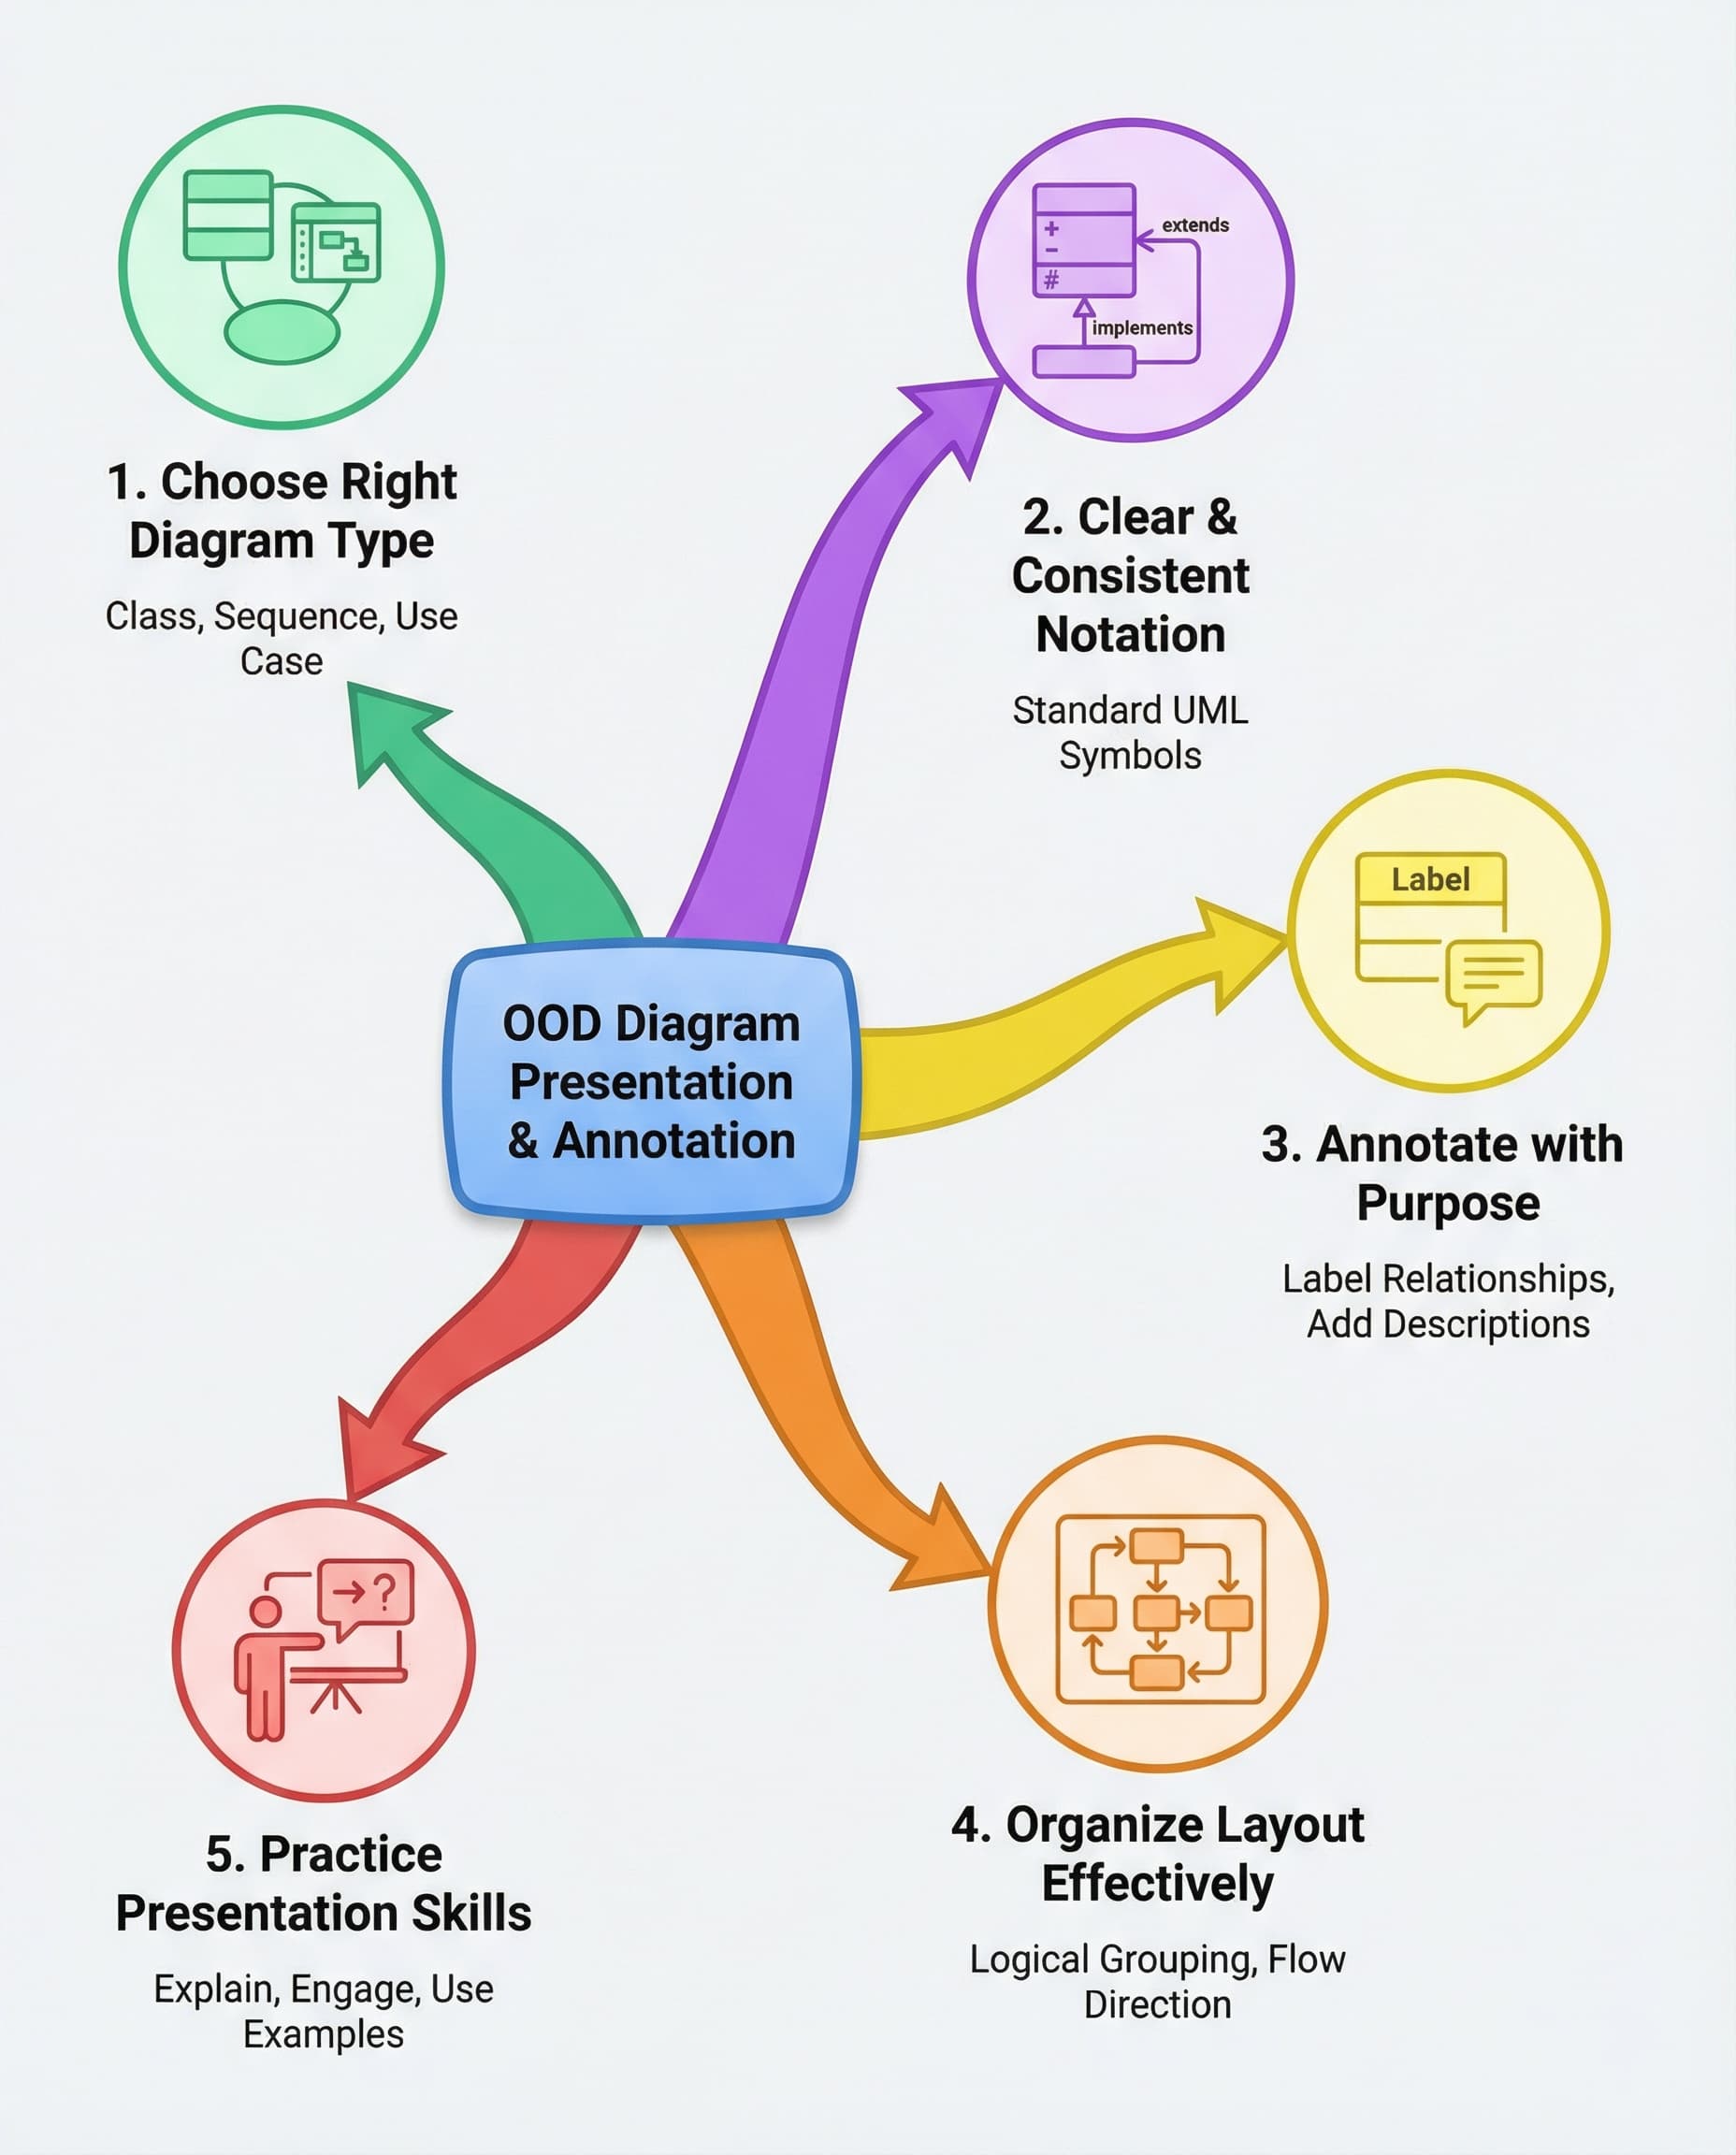
In interviews, interviewers judge object-oriented design (OOD) diagrams on clarity, not artistry. You often have one shot to communicate your design decisions—if the interviewer can’t parse your diagram in about 60 seconds, you’ll spend the rest of the time explaining what should have been obvious. Here’s a practical checklist to make your diagrams instantly readable and persuasive.
1. Pick the right diagram for the question
- Class diagram — when the question focuses on objects, responsibilities, and relationships. Use it for domain modeling and API surface.
- Sequence diagram — when the question is about runtime interactions, message flow, or use-case execution.
- Use-case or simple flow diagram — when the focus is user goals and system boundaries.
- State or activity diagrams — when the question is about lifecycle, state transitions, or background processing.
Use the diagram type that most directly answers the prompt.
2. Use consistent UML (and keep it simple)
- Use clear class/object names (nouns for classes, verbs for methods where needed).
- Show visibility if it matters: + public, - private, # protected.
- Use correct relationship arrows and keep them consistent:
- Inheritance: solid line with hollow triangle (—|>)
- Association: solid line
- Aggregation: hollow diamond (o—)
- Composition: filled diamond (*—)
- Dependency: dashed arrow (-->)
- If your audience doesn’t need full UML fidelity, use consistent, minimal symbols and call out what they mean.
3. Annotate with intent
- Label relationships with short intent notes: e.g., "owns", "caches", "calls", "1..*" for multiplicity.
- Add a tiny legend (2–4 items) if you use nonstandard colors or symbols.
- Highlight or outline only the elements relevant to the interview question (use a light color or box to draw attention).
4. Keep the layout clean
- Group related elements: put components or classes that belong to the same module near each other.
- Align boxes and keep consistent spacing — the eye reads rows/columns more quickly than a messy scatter.
- Guide the eye with flow: left-to-right for processes, top-to-bottom for layers.
- Avoid crossing lines; use curved or routed connectors if necessary, or re-arrange to reduce visual clutter.
- Collapse or omit irrelevant details: you don’t need every attribute or helper class—only what supports your argument.
5. Present it step-by-step
- Start with a one-line summary: "This diagram shows how X handles Y under Z conditions." (5–10 seconds)
- Point to the highlighted area and explain the key path or relationship (20–30 seconds).
- Mention alternatives or trade-offs briefly if asked (10–20 seconds).
- Invite a quick question: "Would you like me to expand any part?"
Example 30–45s script: "This class diagram shows the core domain objects for the payment flow. The PaymentProcessor (highlighted) orchestrates Payment and Wallet objects. The solid line indicates a direct association; the filled diamond shows composition where a Payment owns its PaymentItems. I omitted helper classes to keep focus—happy to dive in on persistence or error handling."
6. Quick 60-second readability checklist
- [ ] Chosen diagram type matches the question
- [ ] Names are clear and consistent
- [ ] Relationship arrows and visibility are used consistently
- [ ] Intent labels or a small legend included
- [ ] Related parts grouped and highlighted
- [ ] No unnecessary details cluttering the view
- [ ] Presentation script ready (30–45s)
Be deliberate: good diagrams aren’t about artistic flair, they’re about communication. If your diagram can be understood in 60 seconds, you’ve done your job—everything else is detail.
#ObjectOrientedDesign #SystemDesign #TechInterviews

