
Microservices Observability: The 3 Pillars Interviewers Expect You to Master

bugfree.ai is an advanced AI-powered platform designed to help software engineers master system design and behavioral interviews. Whether you’re preparing for your first interview or aiming to elevate your skills, bugfree.ai provides a robust toolkit tailored to your needs. Key Features:
150+ system design questions: Master challenges across all difficulty levels and problem types, including 30+ object-oriented design and 20+ machine learning design problems. Targeted practice: Sharpen your skills with focused exercises tailored to real-world interview scenarios. In-depth feedback: Get instant, detailed evaluations to refine your approach and level up your solutions. Expert guidance: Dive deep into walkthroughs of all system design solutions like design Twitter, TinyURL, and task schedulers. Learning materials: Access comprehensive guides, cheat sheets, and tutorials to deepen your understanding of system design concepts, from beginner to advanced. AI-powered mock interview: Practice in a realistic interview setting with AI-driven feedback to identify your strengths and areas for improvement.
bugfree.ai goes beyond traditional interview prep tools by combining a vast question library, detailed feedback, and interactive AI simulations. It’s the perfect platform to build confidence, hone your skills, and stand out in today’s competitive job market. Suitable for:
New graduates looking to crack their first system design interview. Experienced engineers seeking advanced practice and fine-tuning of skills. Career changers transitioning into technical roles with a need for structured learning and preparation.
Microservices Observability: The 3 Pillars Interviewers Expect You to Master
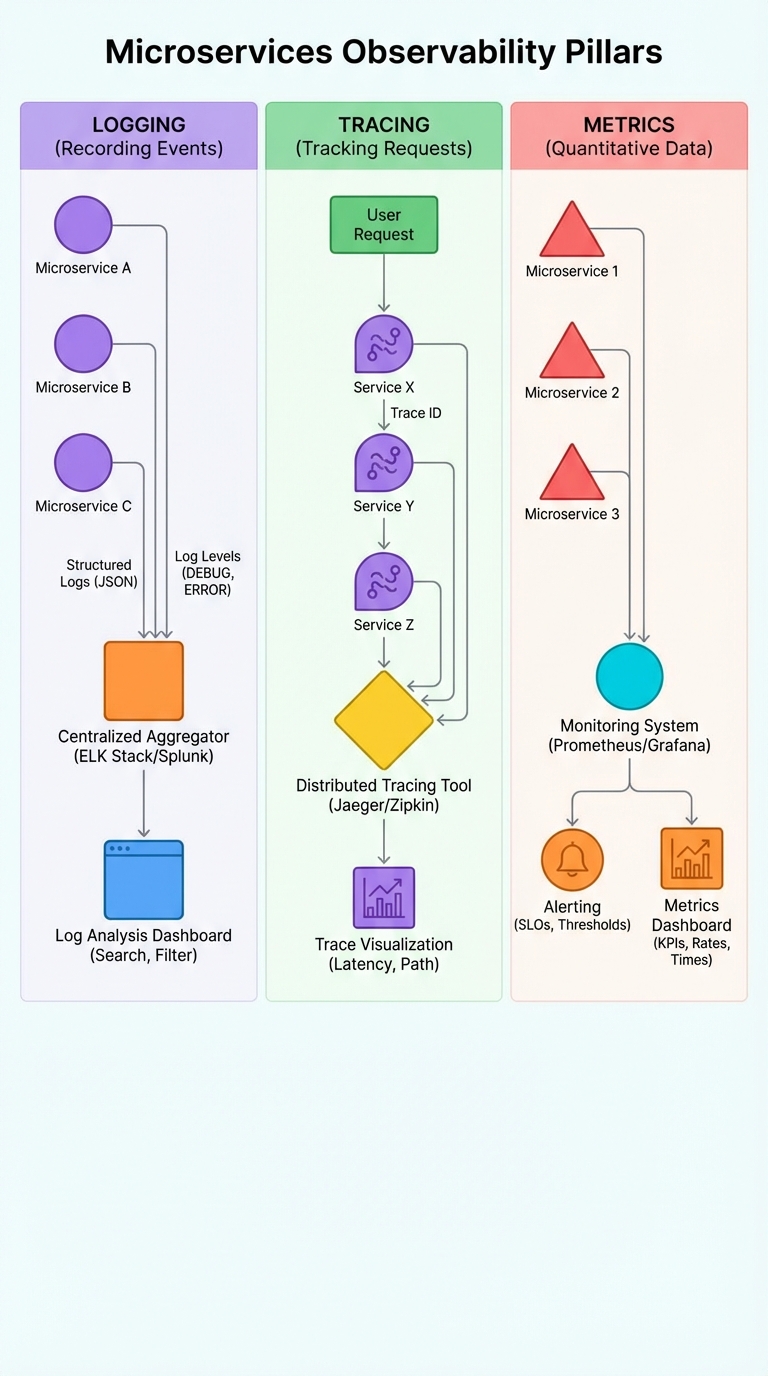
If you can't observe a microservice system, you can't reliably operate it. Interviewers commonly expect clear, concise knowledge of the three observability pillars: logs, tracing, and metrics. Know what each pillar does, how they fit together, what tools to use, and what to say in an interview.
1) Logging — Structured, centralized, and correlated
Why it matters
- Logs provide the narrative of what happened. They're indispensable for root-cause analysis and auditability.
Best practices
- Emit structured JSON logs (not free-form text). Include fields like timestamp, level, service, environment, request_id/trace_id, span_id, user_id, and any domain context.
- Use correct log levels (DEBUG/INFO/WARN/ERROR). Don’t log sensitive data.
- Centralize logs (ELK/Elasticsearch + Logstash + Kibana, Splunk, or cloud logging services) to search and correlate across services.
Example structured log
{
  "timestamp": "2026-01-01T12:00:00Z",
  "level": "ERROR",
  "service": "orders-api",
  "env": "prod",
  "trace_id": "4bf92f3577b34da6a3ce929d0e0e4736",
  "span_id": "00f067aa0ba902b7",
  "request_id": "req-123",
  "message": "Payment gateway timeout",
  "user_id": "u-456"
}
Interview tip
- Say “structured logs + a centralized store so I can grep and correlate with trace IDs” — concrete examples score points.
2) Tracing — Follow requests across services
Why it matters
- Distributed tracing shows request flow and latency across microservices, revealing hotspots and causal paths.
Best practices
- Instrument services with OpenTelemetry (or libraries compatible with Jaeger/Zipkin). Propagate a trace_id and span_id across all RPCs and async boundaries.
- Capture meaningful span names and key attributes (DB queries, external calls, cache hits, payload sizes).
- Use sampling wisely to balance observability and storage costs; keep full traces for error cases.
Tools
- Jaeger, Zipkin, Honeycomb, Lightstep, and backend vendors; OpenTelemetry as the standard instrumentation layer.
Interview tip
- Explain how trace IDs are injected into logs and headers (e.g., via middleware) so tracing + logging = fast root-cause identification.
3) Metrics — Quantify system health and set SLOs
Why it matters
- Metrics provide real-time signals (RPS, latency percentiles, error rates) that drive alerts and dashboards.
Key metrics to track
- Throughput (requests per second), success/error rates, latency percentiles (p50/p95/p99), resource metrics (CPU/memory), queue lengths.
Instrumentation
- Use counters, gauges, histograms. Prometheus + Grafana is the common open-source stack; many clouds offer managed metrics.
SLOs and alerting
- Define SLIs (what you measure) and SLOs (target objectives), then create alerts that reflect SLO burn rates rather than raw thresholds.
- Example: SLO = 99.9% of requests < 300ms over a 30-day window.
Interview tip
- Mention SLI/SLO/SLAs and how metrics drive both dashboards and actionable alerts.
How the three pillars work together
- Correlate: trace_id links traces and logs; metrics surface the issue; traces reveal the causal path; logs show the details.
- Example workflow: an alert on p99 latency -> open the Grafana dashboard -> find impacted endpoints -> jump to a trace for a slow request -> use trace_id to locate logs for that request.
Practical considerations
- Data retention and cost: set reasonable retention and sampling strategies.
- Privacy & security: avoid logging PII; secure telemetry endpoints.
- Automation: use dashboards, runbooks, automated alerts, and playbooks for common incidents.
Quick interview-ready answers
- "I emit structured JSON logs with trace_id for correlation and centralize them in ELK/Splunk for search and analytics."
- "I use OpenTelemetry to propagate trace IDs; Jaeger/Zipkin or hosted tracing to find cross-service bottlenecks."
- "I export metrics to Prometheus, visualize in Grafana, and define SLIs and SLOs to drive meaningful alerts."
Strong observability means faster debugging, fewer outages, and more confident deployments. Be ready to cite tools and a small end-to-end example — that's what interviewers remember.
#SystemDesign #Microservices #DevOps

