High-Score (Bugfree Users) Meta Data Scientist Onsite: DSA + System Design Highlights
Posted by Bugfree users — a high-score interview experience from a Meta Data Scientist (Analytics/DSA) onsite.
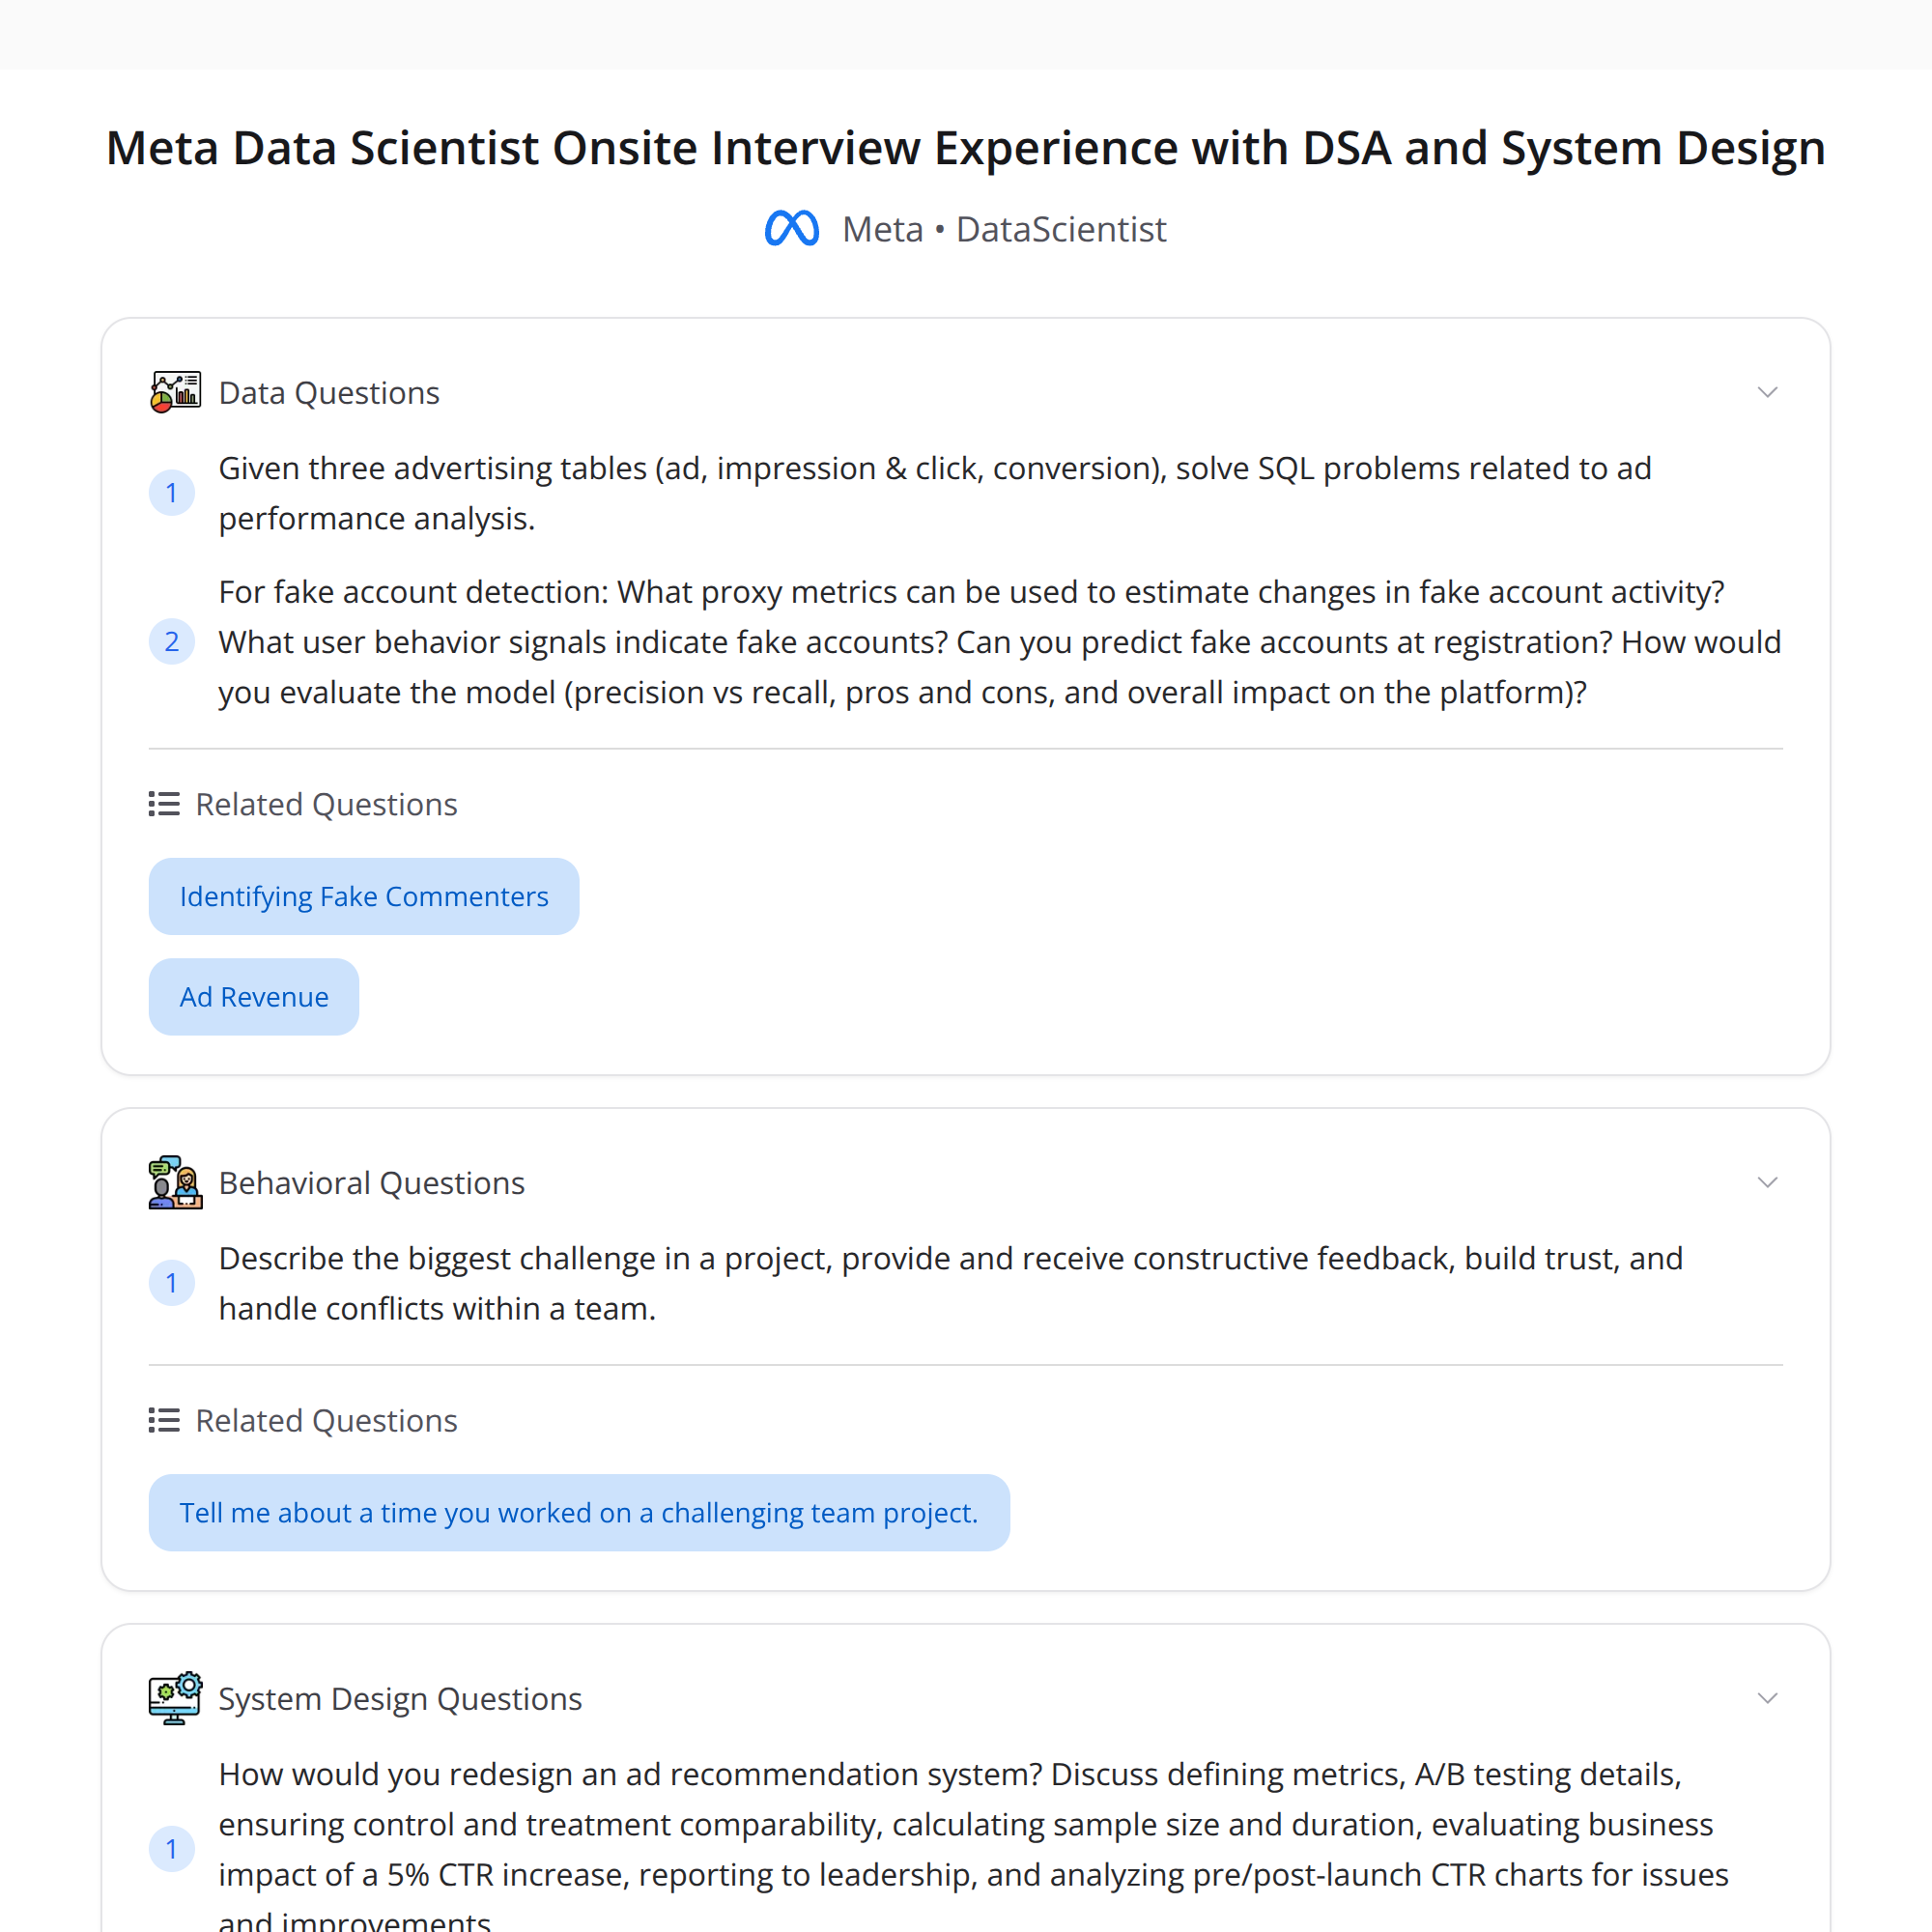
This write-up condenses the practical highlights and re-usable advice from a strong onsite interview at Meta for a Data Scientist role (Analytics / DSA). Focus areas were split across four pillars: SQL, Analytics Execution, Analytics Reasoning, and Behavioral. A system-design question focused on redesigning an ad recommendation pipeline with rigorous A/B testing, metric definition, and leadership-friendly presentation.
Quick summary (what to prioritize)
- Prep across four pillars: SQL, Analytics Execution, Analytics Reasoning, Behavioral.
- Expect "rare" or tricky questions that test edge-case thinking (don’t rely only on patterns).
- System design prompt: redesign ad recommendations — define metrics, plan rigorous A/B test, sample size/duration, interpret lift, and present results.
- SQL can be deceptively tricky with ad tables (impressions/clicks/conversions) — avoid join-induced double-counting.
- Analytics Execution: build fake-account detection using proxy metrics + behavioral signals; evaluate with precision/recall and think in Bayesian/binomial terms.
- Behavioral: concrete examples about conflict, trust, and feedback.
Preparation pillars — expanded
- SQL
- Practice multi-table joins and aggregation patterns, especially ad-like schemas: ads, impressions/clicks, conversions.
- Watch for many-to-many join traps. Aggregate before joining (e.g., counts per impression/ad/user) to avoid duplicates.
- Know window functions, DISTINCT ON, and efficient deduplication techniques for large tables.
Be ready to write a correctness-first query then optimize.
Analytics Execution
- Build pipelines that are auditable and reproducible: data checks, lineage, and clear cohort definitions.
- Use proxy metrics when ground truth is delayed or absent (e.g., account creation patterns, IP velocity, device fingerprinting for fake accounts).
- Evaluate detection systems with precision, recall, F1, ROC/PR curves. Articulate trade-offs: what cost do false positives vs false negatives impose?
Expect statistical drills: basic Bayesian updates and binomial confidence intervals for rates.
Analytics Reasoning
- Define key business metrics and mappings (CTR, CVR, CPA, ARPU, revenue lift).
- Pre-specify primary and guardrail metrics for experiments.
Think about bias sources (selection, instrument, seasonality) and mitigation.
Behavioral
- Prepare short, structured stories about conflict, trust-building, and giving/receiving feedback.
- Use STAR (Situation-Task-Action-Result) with quantifiable outcomes.
System design: redesigning ad recommendations — how the interview approached it
- Define success metrics
- Primary: CTR (click-through rate) or CVR (conversion rate), expected revenue per impression, and conversion value normalized (e.g., ARPU or ROAS).
Guardrails: engagement quality, fraudulent activity, downstream retention, and user experience metrics.
A/B testing rigor
- Randomization unit: ensure independence (e.g., user-id, cookie bucket) and avoid cross-contamination.
- Strive for balance — check pre-treatment comparability on key covariates (region, device, past conversion rates).
Pre-specify analysis plan: primary metric, hypothesis (one-sided/two-sided), corrections for multiple testing, stopping rules.
Sample size & duration (practical approach)
- For proportion metrics (CTR), the sample size depends on baseline rate p, absolute lift Δ, alpha (type I error), and power.
- Rule-of-thumb example: baseline CTR = 2% (0.02). A 5% relative lift → absolute Δ = 0.001 (0.1% point).
- With α=0.05 and power=0.8, you typically need on the order of a few 10^5 impressions per arm (roughly ~300k per arm) to detect a 5% relative lift reliably. Exact n should come from the sample-size formula for two proportions.
Consider seasonality and minimum duration to capture cyclical patterns (weekday vs weekend), not just sample size.
Interpreting a 5% CTR lift
- Clarify relative vs absolute: 5% relative on 2% baseline = 0.02 -> 0.021 (0.1 percentage point).
- Ask about business impact: multiply expected lift by revenue per click or expected downstream conversion to estimate revenue impact.
Check statistical significance (p-values) and the confidence interval. A practically meaningful lift must also be statistically robust.
Presenting to leadership
- Start with the headline: observed lift, CI, and estimated revenue impact (dollars/day or % lift in revenue).
- Show the table: sample sizes, p-values, and guardrail checks.
Highlight risks and next steps: scale plan, monitoring, rollout ramp, or additional experiments for segments.
Diagnosing CTR trend charts
- Plot raw CTR + moving average and confidence intervals (binomial or bootstrapped CIs) to visualize uncertainty.
- Overlay sample size per bin — low-sample bins will have wide CIs.
- If there’s drift, check instrumentation, seasonal effects, or changes in traffic mix.
SQL-specific pitfalls (common traps in ad tables)
- Typical schema: ads table (ad_id, campaign_id, metadata), impressions/clicks table (impression_id, ad_id, user_id, timestamp), conversions table (conversion_id, impression_id or click_id, value).
- Trap: joining impressions -> clicks -> conversions naively can multiply rows (many clicks per impression or many conversions per click). Fix: aggregate events to the correct grain first (e.g., counts per impression_id or per ad_id per day) and then join.
- Counting uniques: when counting users or conversions, use exact identifiers (user_id or conversion_id) rather than SUM(clicks) after a join.
- Performance tip: pre-aggregate large event tables into daily partitions and read only necessary windows.
Fake-account detection & evaluation
- Signals to consider
- Velocity signals: accounts created per IP per hour, rapid session starts.
- Behavioral signals: click patterns, abnormal conversion rates, session duration, event frequency distributions, too-regular inter-event times.
Device / fingerprint signals: many accounts from same device fingerprint or user agent anomalies.
Model evaluation
- Use precision/recall and PR curve when class imbalance is high.
- Tune thresholds to manage operational costs: blocking false accounts has different cost than letting some fraud through.
Consider producing a risk score and triage: high-score auto-block, medium-score manual review.
Bayesian/binomial thinking
- Be ready to update beliefs: e.g., if you observe 10 conversions out of 100 suspected accounts vs expected baseline 1%, compute posterior distribution of conversion rate to decide whether the cohort is anomalous.
- Use credible intervals to express uncertainty.
Behavioral examples to prepare
- Conflict: describe a time you disagreed with a technical approach, how you surfaced data, proposed alternatives, and reached alignment.
- Trust: explain how you built trust with partners (regular syncs, transparent metrics, shared dashboards, reproducible analyses).
- Feedback: share a time you gave or received constructive feedback and the outcome.
Practical tips for the interview
- Talk through assumptions explicitly. Interviewers often probe your edge-case thinking.
- When asked to design experiments or systems, pre-specify metrics, analysis plan, and failure modes.
- Show familiarity with both statistical rigor (CIs, sample sizes) and product trade-offs (velocity, risk tolerance).
- For SQL, write a correct readable query first, then discuss optimization.
If you want, I can: provide a short set of practice SQL problems modeled on the ad schema, draft a one-page A/B test analysis plan template you could use in interviews, or mock up an example presentation slide that summarizes an A/B result (headline, table, CI plot, recommendation).
#DataScience #Meta #InterviewExperience #DSA #SystemDesign #SQL #ABTesting #Analytics #Career
About the author
bugfree.ai is an advanced AI-powered platform designed to help software engineers master system design and behavioral interviews. Whether you’re preparing for your first interview or aiming to elevate your skills, bugfree.ai provides a robust toolkit tailored to your needs. Key Features:
150+ system design questions: Master challenges across all difficulty levels and problem types, including 30+ object-oriented design and 20+ machine learning design problems. Targeted practice: Sharpen your skills with focused exercises tailored to real-world interview scenarios. In-depth feedback: Get instant, detailed evaluations to refine your approach and level up your solutions. Expert guidance: Dive deep into walkthroughs of all system design solutions like design Twitter, TinyURL, and task schedulers. Learning materials: Access comprehensive guides, cheat sheets, and tutorials to deepen your understanding of system design concepts, from beginner to advanced. AI-powered mock interview: Practice in a realistic interview setting with AI-driven feedback to identify your strengths and areas for improvement.
bugfree.ai goes beyond traditional interview prep tools by combining a vast question library, detailed feedback, and interactive AI simulations. It’s the perfect platform to build confidence, hone your skills, and stand out in today’s competitive job market. Suitable for:
New graduates looking to crack their first system design interview. Experienced engineers seeking advanced practice and fine-tuning of skills. Career changers transitioning into technical roles with a need for structured learning and preparation.
Comments
Join the discussionNo comments yet. Be the first to comment.