
High-Score Meta Data Scientist Interview Experience: Behavioral, Stats, SQL & Product
bugfree.ai is an advanced AI-powered platform designed to help software engineers master system design and behavioral interviews. Whether you’re preparing for your first interview or aiming to elevate your skills, bugfree.ai provides a robust toolkit tailored to your needs. Key Features:
150+ system design questions: Master challenges across all difficulty levels and problem types, including 30+ object-oriented design and 20+ machine learning design problems. Targeted practice: Sharpen your skills with focused exercises tailored to real-world interview scenarios. In-depth feedback: Get instant, detailed evaluations to refine your approach and level up your solutions. Expert guidance: Dive deep into walkthroughs of all system design solutions like design Twitter, TinyURL, and task schedulers. Learning materials: Access comprehensive guides, cheat sheets, and tutorials to deepen your understanding of system design concepts, from beginner to advanced. AI-powered mock interview: Practice in a realistic interview setting with AI-driven feedback to identify your strengths and areas for improvement.
bugfree.ai goes beyond traditional interview prep tools by combining a vast question library, detailed feedback, and interactive AI simulations. It’s the perfect platform to build confidence, hone your skills, and stand out in today’s competitive job market. Suitable for:
New graduates looking to crack their first system design interview. Experienced engineers seeking advanced practice and fine-tuning of skills. Career changers transitioning into technical roles with a need for structured learning and preparation.
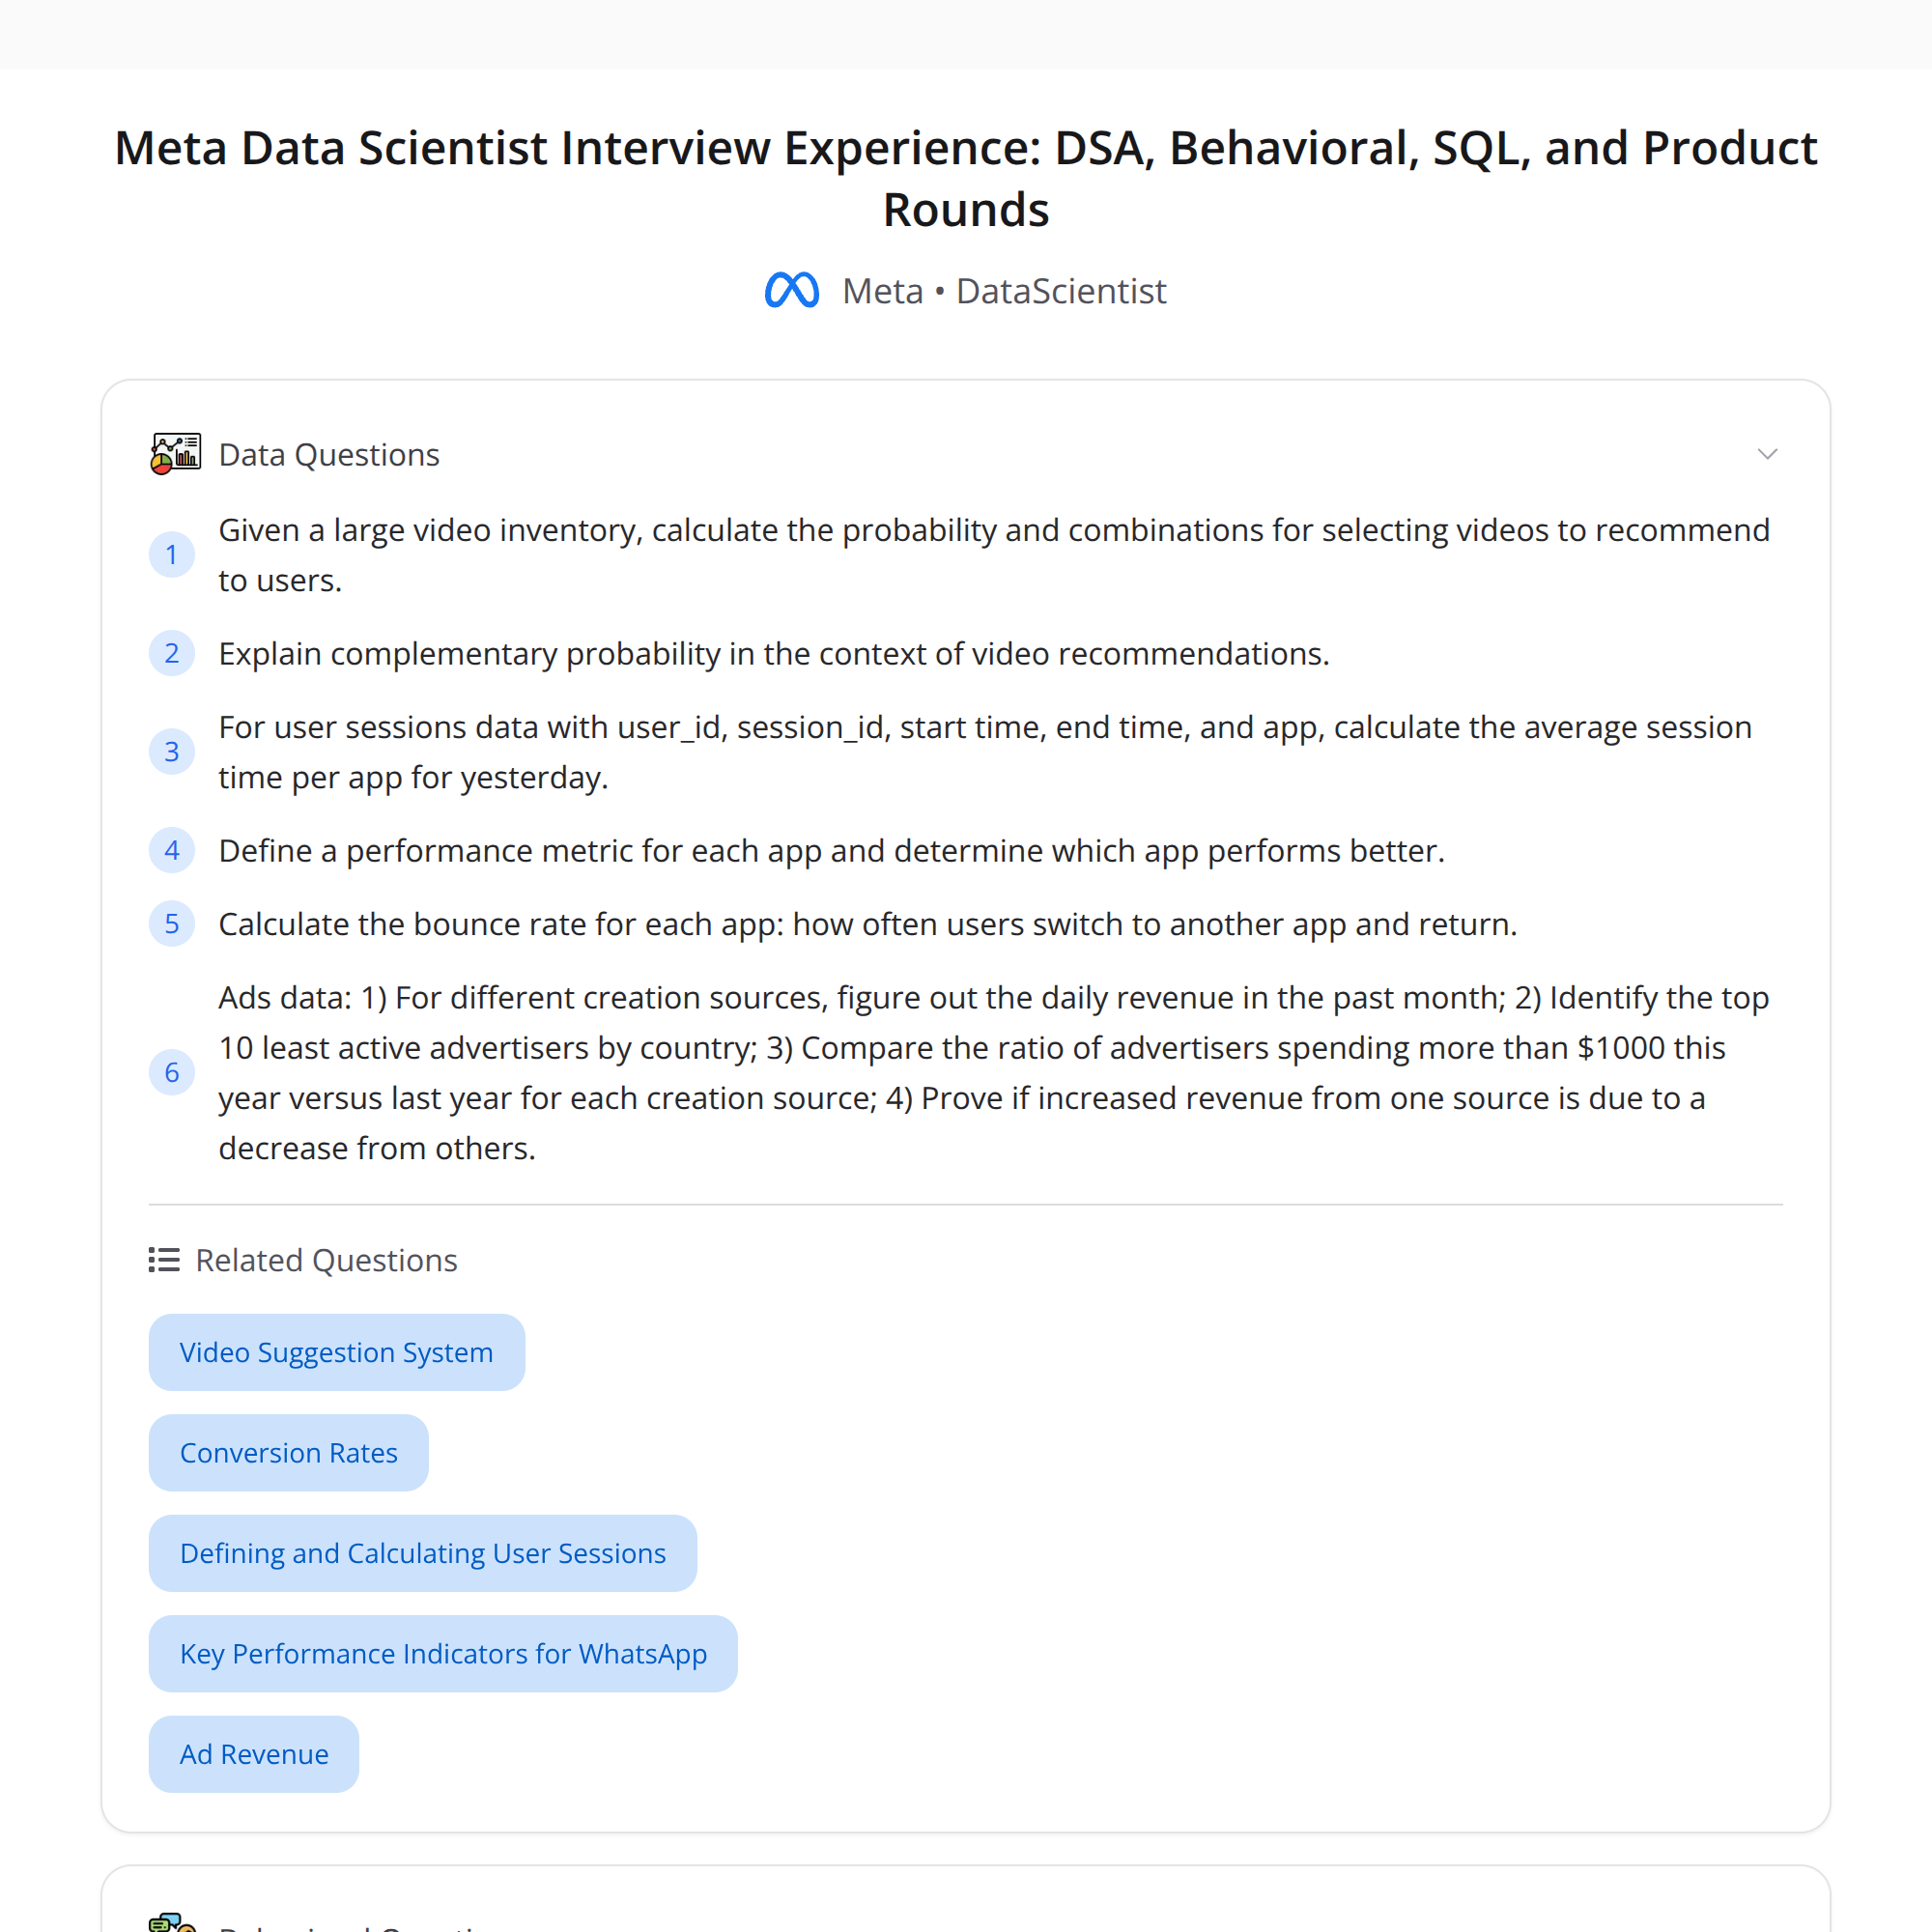
High-Score (Bugfree Users) Meta Data Scientist Interview Experience
A compact, practical write-up of a high-scoring Meta Data Scientist interview — pulled from a community post and expanded with tips you can use during prep.
Quick highlights
- Behavioral: prepare 10–12 detailed STAR stories (failure, ambiguity, trust, inclusion, conflict). Focus on specifics: metrics, timeline, your decision process, and measurable outcomes.
- DS / Stats: expect probability and combinatorics questions plus product-sense reasoning. Even if they say “no modeling,” be ready for estimation and trade-off questions.
- SQL: session analytics is common — avg session time, app metrics, bounce and switch-back rates. Be comfortable with %s, averages, percentiles, window functions and sessionization logic.
- Product: example prompt — build a chatbot for retailers. Define value, choose metrics, propose alternatives when A/B testing isn’t possible, and be ready to critique charts.
1) Behavioral (STAR, but with numbers)
Tips:
- Prepare 10–12 stories covering: a clear failure, handling ambiguity, building trust, promoting inclusion, and resolving conflict.
- Use STAR (Situation, Task, Action, Result) and include measurable results (percent uplift, time saved, error reduction, sample sizes, timeframes).
- Be specific: name stakeholders, the data sources you used, tools, and constraints.
- When asked about trade-offs, explicitly state assumptions, costs, and how you would measure success.
Example structure for a failure story:
- Situation: what product or team and what KPI was affected.
- Task: your role and objective.
- Action: hypotheses you tested, datasets, analyses, and stakeholder communication.
- Result: concrete numbers (e.g., reduced error by 23% in 4 weeks) and what you learned.
2) DS / Stats (what to practice)
Focus areas:
- Probability and combinatorics: conditional probability, expected value, permutations/combinations. Practice problems like conditional events and urn-style questions.
- Estimation & product sense: be ready to reason about baselines, uplift, and guardrails without building a full model.
- Hypothesis testing basics: p-values, effect size, power, and practical significance.
- Causal reasoning: when to run experiments, how to interpret observational results, confounders.
Example quick prompts to rehearse:
- "Estimate weekly active users for a new feature and justify assumptions."
- "You observe a 3% drop in retention. List hypotheses and how you'd triage them."
3) SQL — session analytics (practical patterns)
Common asks: average session time, session counts per user, bounce rate, switch-back rate, retention by cohort.
Helpful patterns:
- Sessionization: use event timestamps + LAG() to break sessions on gaps (commonly 30 minutes).
- Aggregate session duration and compute averages, medians, percentiles.
- Define bounce carefully (e.g., session with single view or duration < X seconds) and compute as % of sessions.
Sample SQL (schematic):
WITH events AS (
  SELECT user_id, event_time, event_type,
         LAG(event_time) OVER (PARTITION BY user_id ORDER BY event_time) as prev_time
  FROM raw_events
), sessions AS (
  SELECT *,
         SUM(CASE WHEN prev_time IS NULL OR TIMESTAMP_DIFF(event_time, prev_time, MINUTE) > 30 THEN 1 ELSE 0 END)
           OVER (PARTITION BY user_id ORDER BY event_time) as session_id
  FROM events
), session_stats AS (
  SELECT user_id, session_id,
         MIN(event_time) as session_start,
         MAX(event_time) as session_end,
         TIMESTAMP_DIFF(MAX(event_time), MIN(event_time), SECOND) as session_length_seconds,
         COUNT(*) as events_in_session
  FROM sessions
  GROUP BY user_id, session_id
)
SELECT
  AVG(session_length_seconds) AS avg_session_sec,
  PERCENTILE_CONT(session_length_seconds, 0.5) OVER () AS median_session_sec,
  SUM(CASE WHEN events_in_session = 1 THEN 1 ELSE 0 END) * 1.0 / COUNT(*) AS bounce_rate
FROM session_stats;
Notes:
- Switch-back rate: define "switch-back" (e.g., user leaves app and returns within X minutes/hours). You may need app-foreground/background events or compare sessions separated by a short gap.
- Be explicit about definitions (session timeout, what counts as a bounce) and how they affect metrics.
4) Product prompt: chatbot for retailers — how to structure your answer
Walk through a concise product framework:
- Clarify scope & personas: is this for store clerks, shoppers, or both? B2B dashboard vs. consumer chat?
- Define the value: reduce support load, increase conversion, shorten path-to-purchase, improve average order value (AOV).
- Proposed metrics (primary + guardrail):
- Primary: resolution rate, conversion lift (orders / sessions where chatbot engaged), revenue per session, time-to-resolution.
- Engagement: messages per session, session length, retention of users interacting with bot.
- Quality & safety: FCR (first contact resolution), escalation rate to humans, false positives, NPS.
- Measurement plan: A/B test where possible; measure lift with confidence intervals, runpower calculations, and monitor short/long-term impact.
- Alternatives when A/B is not possible:
- Phased rollout (rolling waves by region or account size) + difference-in-differences.
- Synthetic control or matched cohort analyses.
- Instrumental variables or regression discontinuity if there’s a policy cutoff.
- Offline evaluation using labeled conversations and human raters.
- Risks & guardrails: hallucination risk, privacy, perverse incentives (bot drives clicks but not purchases).
Be ready to propose simple baselines (rule-based bot) and incremental improvements (intent classification → rerank → RL-based personalization).
5) Chart critique — what to call out quickly
When asked to critique a chart, cover these points fast:
- Is the axis labeled? Are units and time windows clear?
- Is the aggregation appropriate (per-user vs per-session)?
- Are sample sizes visible? Any confidence intervals or error bars?
- Any suspicious smoothing or truncated axes that mislead magnitude?
- Look for confounders, seasonality, or changes to how data was collected.
- Suggest next steps: segment by key cohorts, add CI, or compare to baseline period.
Rapid prep checklist
- Behavioral: 10–12 STAR stories with numbers.
- Stats: practice probability, expectation, and A/B interpretation exercises.
- SQL: sessionization, window functions, percentiles, and clear definitions of metrics.
- Product: define value, pick 2–3 primary metrics, propose measurement and fallbacks when experiments aren’t possible.
Good luck — focus on clarity, assumptions, and the metrics that tie your decisions back to business impact.
#DataScience #SQL #InterviewPrep

