
High-Score (Bugfree Users) Interview Experience: Meta Data Scientist (DSPA VO) — What Really Gets Tested
bugfree.ai is an advanced AI-powered platform designed to help software engineers master system design and behavioral interviews. Whether you’re preparing for your first interview or aiming to elevate your skills, bugfree.ai provides a robust toolkit tailored to your needs. Key Features:
150+ system design questions: Master challenges across all difficulty levels and problem types, including 30+ object-oriented design and 20+ machine learning design problems. Targeted practice: Sharpen your skills with focused exercises tailored to real-world interview scenarios. In-depth feedback: Get instant, detailed evaluations to refine your approach and level up your solutions. Expert guidance: Dive deep into walkthroughs of all system design solutions like design Twitter, TinyURL, and task schedulers. Learning materials: Access comprehensive guides, cheat sheets, and tutorials to deepen your understanding of system design concepts, from beginner to advanced. AI-powered mock interview: Practice in a realistic interview setting with AI-driven feedback to identify your strengths and areas for improvement.
bugfree.ai goes beyond traditional interview prep tools by combining a vast question library, detailed feedback, and interactive AI simulations. It’s the perfect platform to build confidence, hone your skills, and stand out in today’s competitive job market. Suitable for:
New graduates looking to crack their first system design interview. Experienced engineers seeking advanced practice and fine-tuning of skills. Career changers transitioning into technical roles with a need for structured learning and preparation.
TL;DR
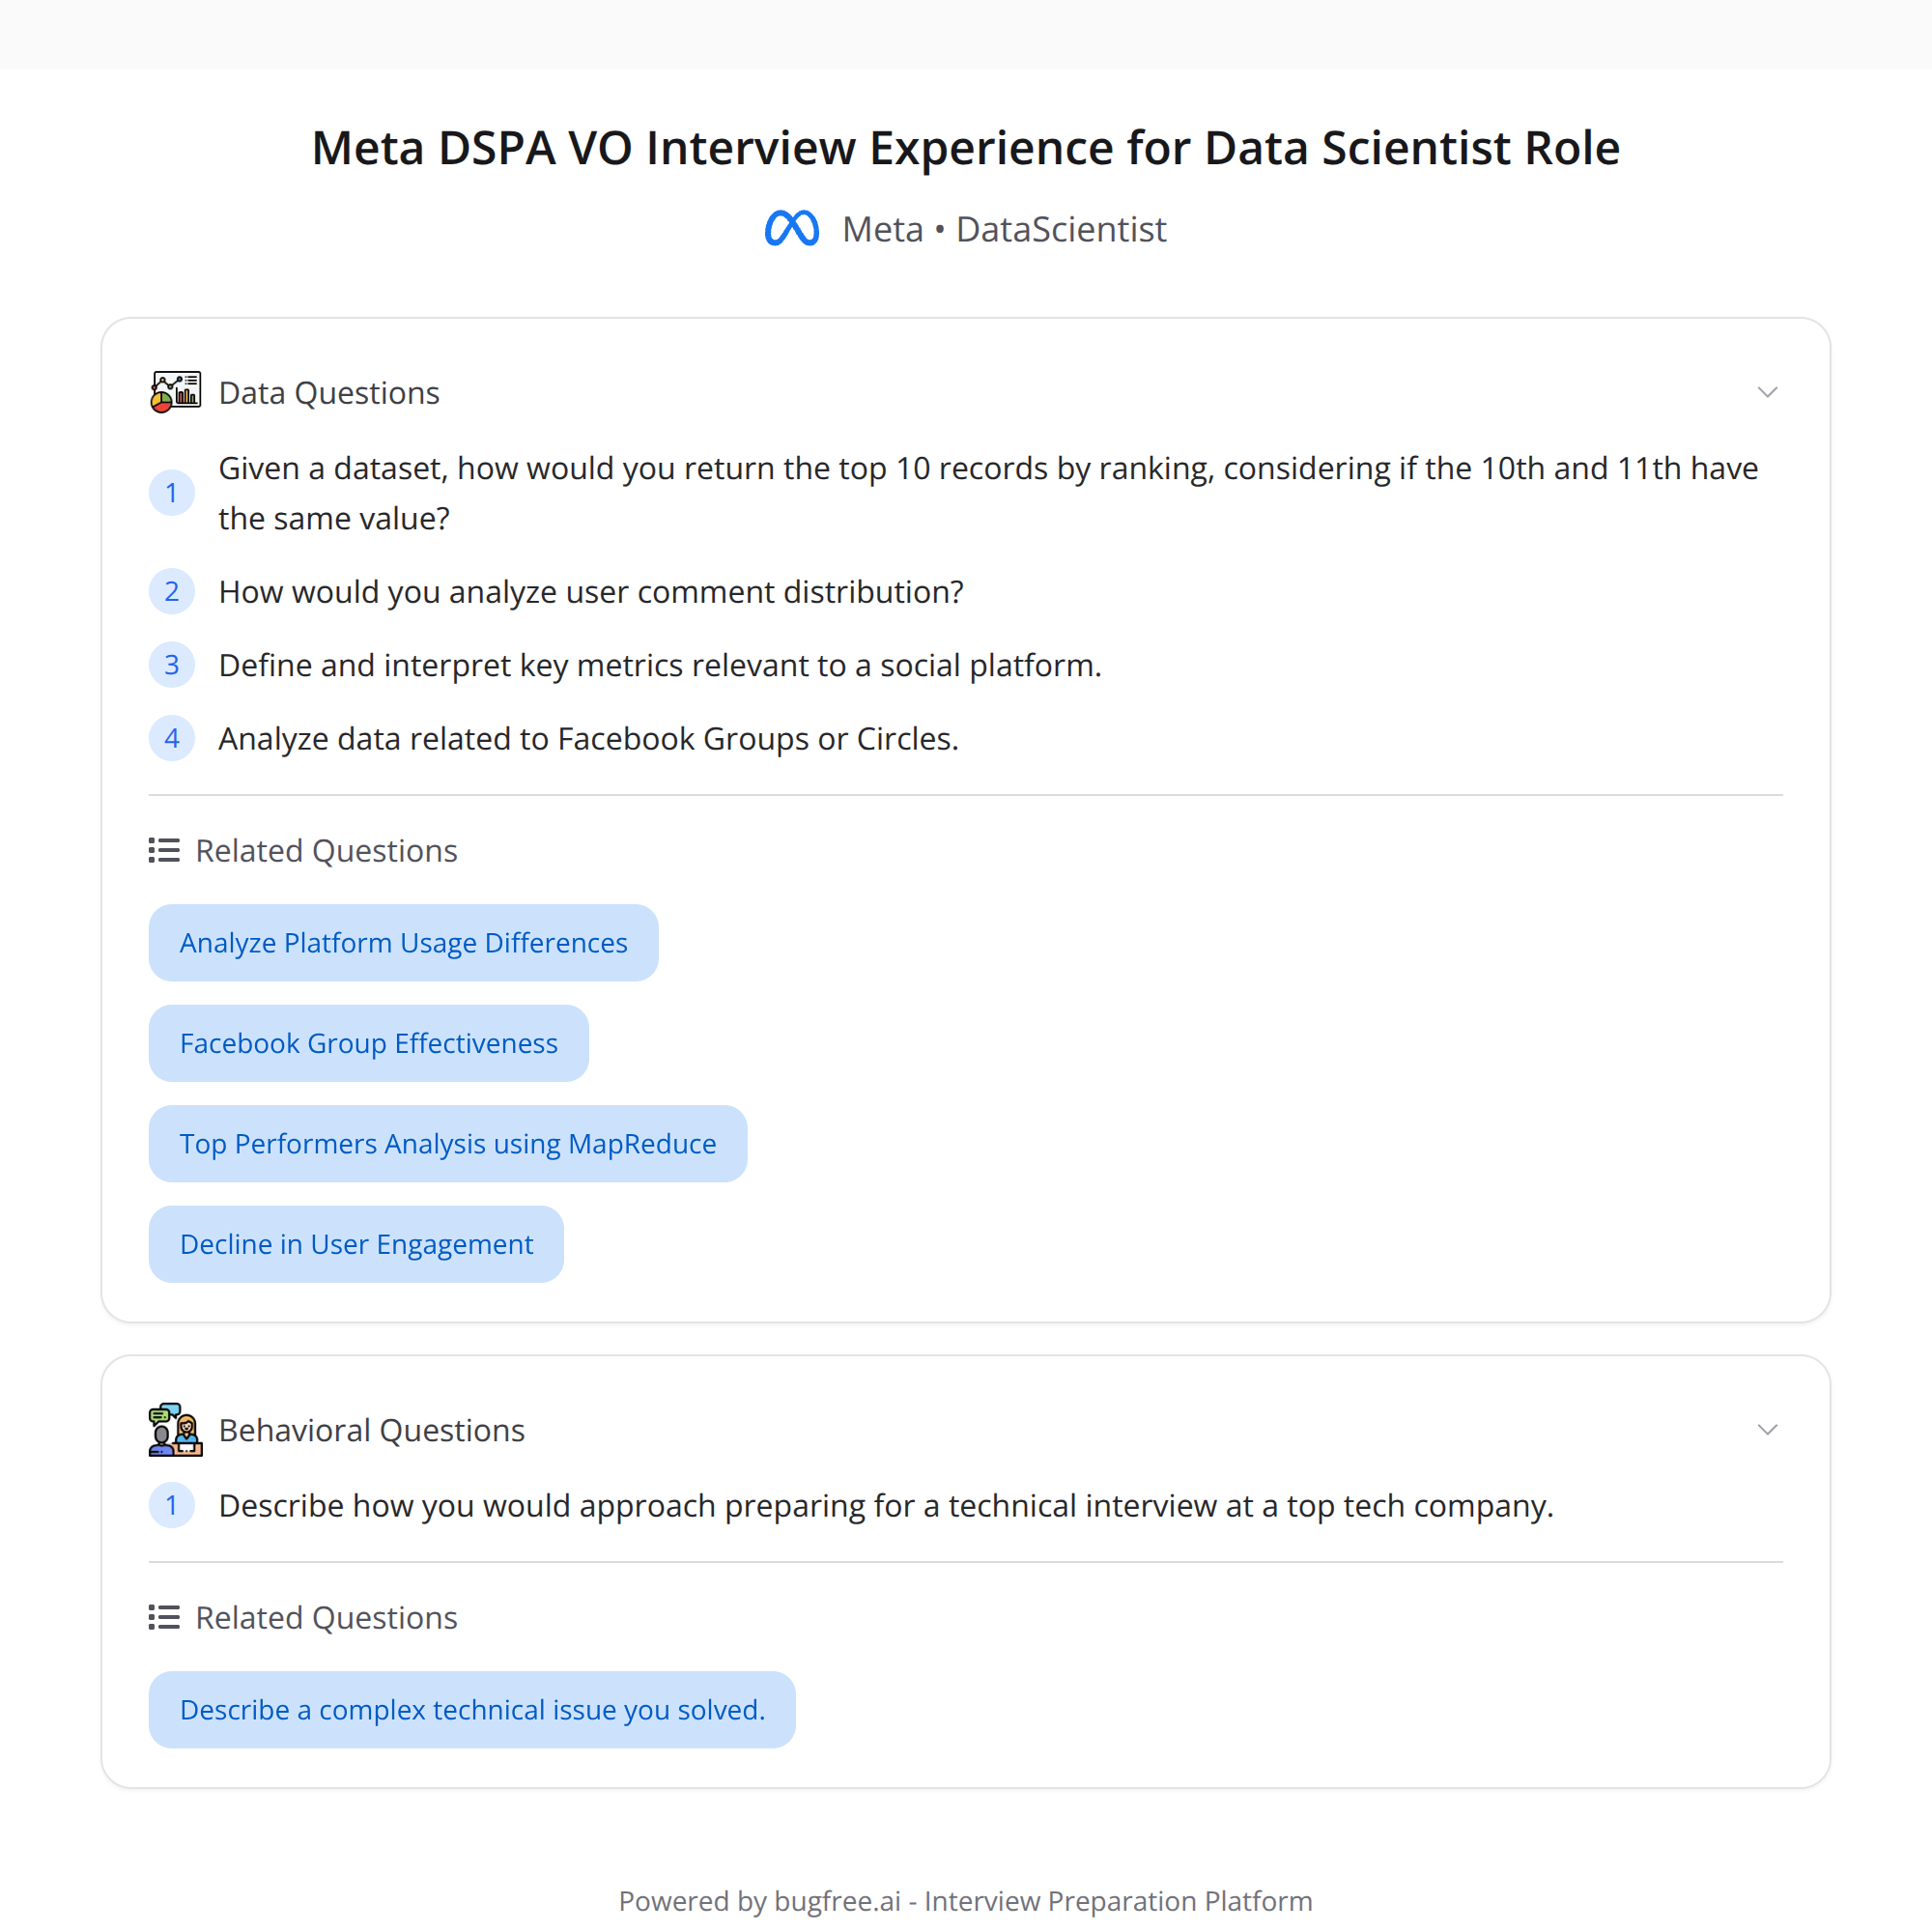
- Firsthand recap of a Meta Data Scientist (DSPA VO) interview focused on real-world analytics and product thinking.
- Key technical: a tricky SQL ranking edge case on an OCULUS dataset — 10th/11th tied; interviewer expected careful tie-breaking.
- Product/analytics: designing metrics from comment distribution, questions about Facebook Circles/Groups.
- Compared to some Amazon screens, Meta expects metric/product thinking earlier. HR process was clear and helpful.
Overview
I interviewed for Meta’s Data Scientist role (DSPA VO). The loop was rigorous and very much "real-world" — not just algorithm puzzles but product analytics, metric design, and careful SQL. Below are the highlights, what they were testing, and how I’d recommend preparing.
What was tested (high-level)
- SQL + data handling: window functions and edge-case thinking (ranking + tie-breaking). Performance and clean, deterministic outputs mattered.
- Metric design / analytics: defining useful metrics from user comment distributions and arguing why those metrics matter.
- Product sense: how communities (Circles / Facebook Groups) behave, trade-offs for different metric choices, and how your metrics inform product decisions.
- Communication / collaboration: explaining assumptions, trade-offs, and next steps.
The SQL task: tricky ranking edge case
Task context: an "OCULUS" dataset where you needed to return the top-10 users by some engagement score. A subtle edge case appeared: the 10th and 11th users had the same score (a tie). The interviewer expected you to notice that returning "top 10" with ties can be ambiguous and to handle it explicitly.
What they were checking:
- Do you notice edge cases and articulate assumptions? (e.g., should ties be included or should the result be exactly 10 rows?)
- Do you use the right window function for the requirement? (RANK vs DENSE_RANK vs ROW_NUMBER)
- Can you make the result deterministic? (add a tie-breaker like timestamp or user_id)
Practical SQL approaches (conceptual)
If ties should be included (so you may return more than 10 rows): use RANK() or DENSE_RANK():
SELECT user_id, score, RANK() OVER (ORDER BY score DESC) AS rnk FROM oculus_table WHERE ... -- Then filter rnk <= 10
This returns all users who tie for the 10th position.
If you must return exactly 10 rows: use ROW_NUMBER() with a deterministic tie-breaker (timestamp, user_id):
WITH ranked AS ( SELECT , ROW_NUMBER() OVER (ORDER BY score DESC, user_id ASC) AS rn FROM oculus_table ) SELECT FROM ranked WHERE rn <= 10;
Notes:
- Always state your assumption: whether ties should be preserved or broken. If unspecified, ask the interviewer.
- Mention performance and NULLs/data cleaning if relevant (e.g., missing scores, duplicate records).
Analytics / AE-style questions
One interview focused on designing metrics from the distribution of user comments. Example directions they expect you to cover:
- Simple distribution stats: median, mean, percentiles (P50, P90), standard deviation.
- Engagement buckets: % users with 0, 1–5, 6–20, 20+ comments.
- Contribution concentration: what share of comments come from the top 1% / 5% of users? (Pareto effects)
- Quality signals: ratio of upvotes/flags per comment, average comment length, replies per comment.
- Time-series/cohort metrics: retention, repeat contributors, DAU/MAU, rolling windows.
- Operational metrics: spam/abuse rates, moderation lag, false positive rate for automated filters.
They also asked product-specific questions about Circles / Facebook Groups: how community structure affects engagement metrics, and how you’d instrument and interpret signals differently for small, tight communities vs. large public groups.
How Meta differed from some Amazon SQL screens
- Amazon screens I’ve seen can be more straightforward SQL/logic checks. Meta pushed metric thinking early — not just whether you can write a query, but why the metric matters and how you'd use it for product decisions.
- Expect more product analytics context: you’ll need to justify metric choices, show sensitivity to edge cases, and propose follow-up analyses.
HR experience
HR was one of the standouts: clear steps, timelines, and even prep guidance. Expect structured communication about the process, and use that to clarify the loop format and any prep materials.
Concrete prep checklist (what to practice)
- SQL: window functions (ROW_NUMBER, RANK, DENSE_RANK), aggregation, joins, subqueries, handling ties and NULLs.
- Metric design: practice turning raw distributions into actionable metrics (engagement buckets, percentiles, contribution concentration).
- Product sense: read up on community features (Groups/Circles) — think about moderation, growth, retention, and toxicity signals.
- Behavioral: have examples of cross-functional work, trade-offs you made, and times you discovered a subtle data issue.
- Mock interviews: practice explaining assumptions out loud and asking clarifying questions.
Resources
- LeetCode / Mode Analytics SQL practice
- Articles on metric design: blog posts from product analytics teams, or posts about DAU/MAU, retention curves, and contribution concentration
- Practice writing short metric specs: definition, why it matters, how to compute it, and how it can be gamed or misinterpreted
Final tips
- Always clarify requirements (should ties be included?).
- Make your outputs deterministic when asked for a fixed-size result.
- Tie SQL correctness to product impact — explain why a metric helps the business or surfaces an issue.
- Use HR’s prep guidance to sharpen your answers and focus on what the loop cares about.
If you want, I can:
- Walk through a sample SQL solution for a specific OCULUS-like schema.
- Generate a 1-week study plan tailored to this loop.
Good luck — focus on clear assumptions, deterministic queries, and linking metrics to product decisions.

