
High-Score (Bugfree Users) Interview Experience: Meta Data Scientist (DSPA VO) — What Really Gets Tested
bugfree.ai is an advanced AI-powered platform designed to help software engineers master system design and behavioral interviews. Whether you’re preparing for your first interview or aiming to elevate your skills, bugfree.ai provides a robust toolkit tailored to your needs. Key Features:
150+ system design questions: Master challenges across all difficulty levels and problem types, including 30+ object-oriented design and 20+ machine learning design problems. Targeted practice: Sharpen your skills with focused exercises tailored to real-world interview scenarios. In-depth feedback: Get instant, detailed evaluations to refine your approach and level up your solutions. Expert guidance: Dive deep into walkthroughs of all system design solutions like design Twitter, TinyURL, and task schedulers. Learning materials: Access comprehensive guides, cheat sheets, and tutorials to deepen your understanding of system design concepts, from beginner to advanced. AI-powered mock interview: Practice in a realistic interview setting with AI-driven feedback to identify your strengths and areas for improvement.
bugfree.ai goes beyond traditional interview prep tools by combining a vast question library, detailed feedback, and interactive AI simulations. It’s the perfect platform to build confidence, hone your skills, and stand out in today’s competitive job market. Suitable for:
New graduates looking to crack their first system design interview. Experienced engineers seeking advanced practice and fine-tuning of skills. Career changers transitioning into technical roles with a need for structured learning and preparation.
High-Score (Bugfree Users) Interview Experience: Meta Data Scientist (DSPA VO)
I recently interviewed for Meta’s Data Scientist role (DSPA VO) and wanted to capture what stood out. The loop felt rigorous and very product-focused — much more "real-world" than a pure algorithmic screen. Below are the main highlights, concrete tips, and quick examples to help you prepare.
Quick summary
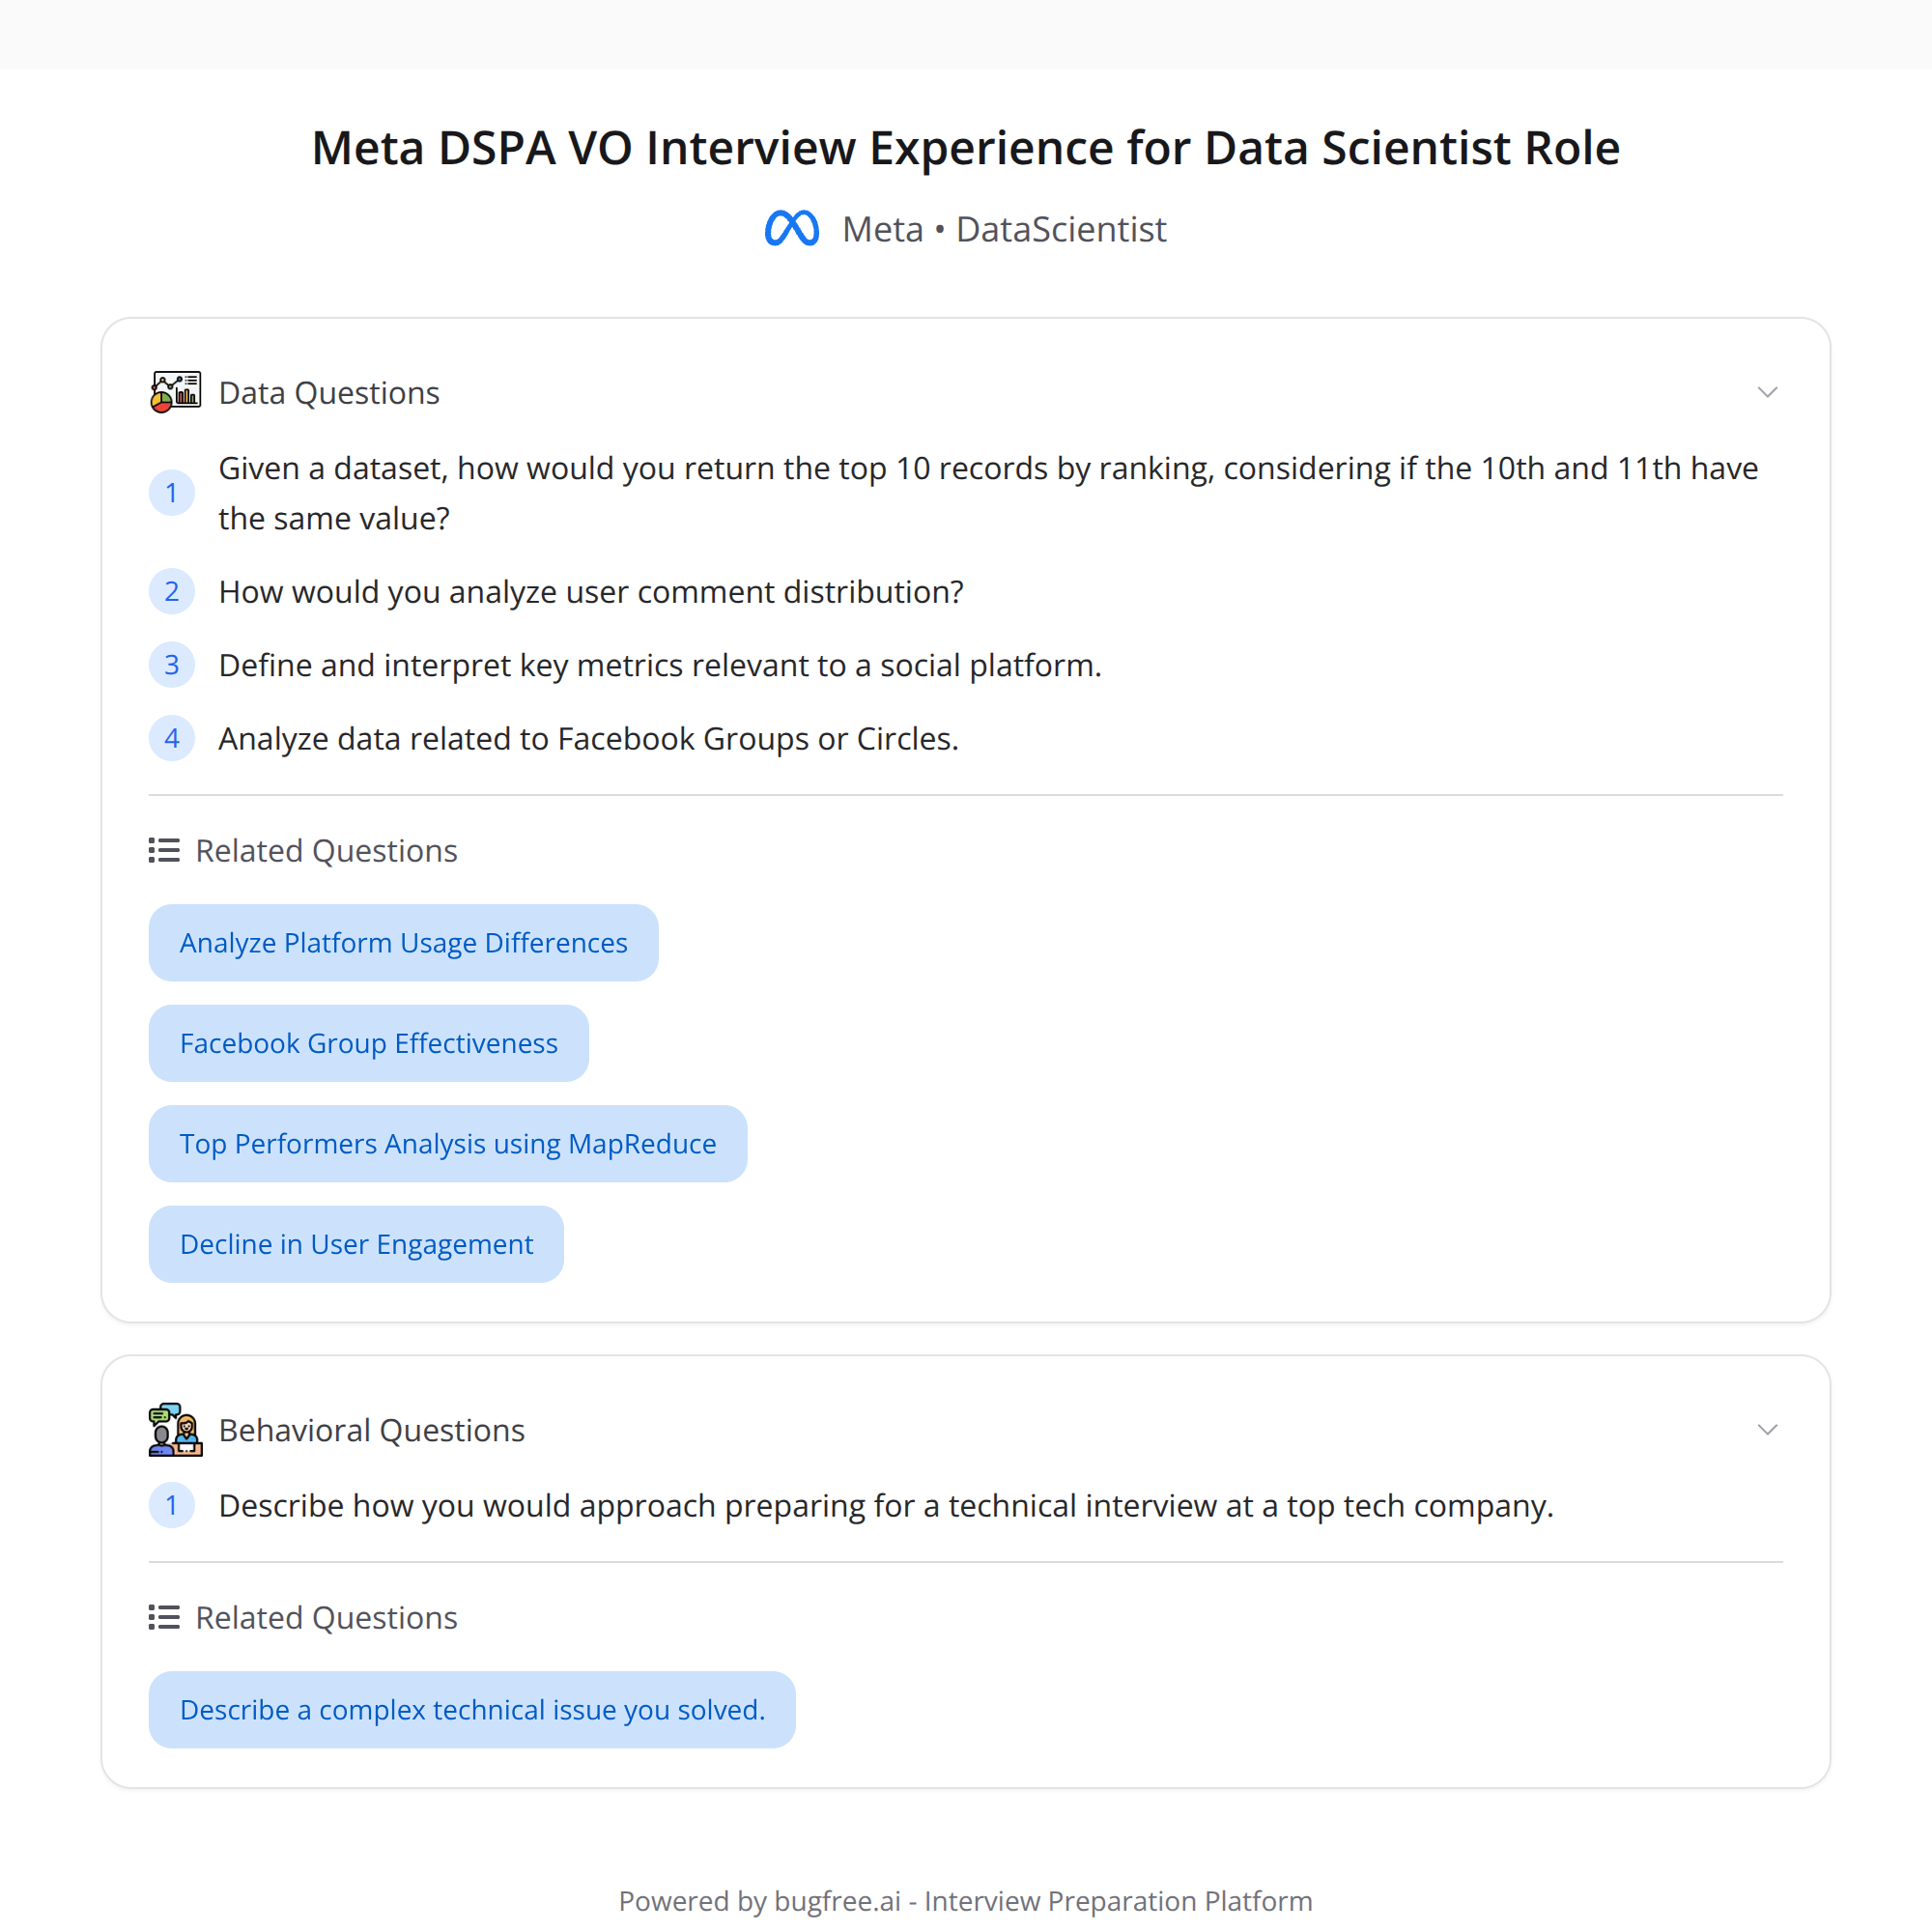
- The SQL task used the OCULUS dataset and featured a subtle edge case: the 10th and 11th ranks were tied, but the problem required returning only the top 10. Handling ties cleanly was essential.
- Analytics/product (AE) questions focused on defining and justifying metrics from a user comment distribution — not just writing queries, but thinking about what to measure and why.
- There were product questions around Circles / Facebook Groups and how you'd reason about engagement, growth, and measurement.
- Compared to Amazon's relatively straightforward SQL screens, Meta expects metric-design and product-thinking even in early technical rounds.
- HR was notably professional: clear timeline, next steps, and concrete prep guidance.
What they were testing — short list
- Edge-case handling in SQL (ties, ranking, nulls)
- Metric design and justification (choice of metric, statistical robustness, segmentation)
- Product sense (how a metric maps to product health or hypothesis)
- Clear communication and trade-off discussion
- Practical knowledge of analytics tools and SQL window functions
The SQL edge case: ties at the cutoff
Problem: using the OCULUS dataset you had to return the top 10 users by some score. The dataset had a tie at ranks 10 and 11. If you naively applied LIMIT 10 after ORDER BY score DESC, you might arbitrarily cut a tied user.
How to approach:
- Ask clarifying questions: should ties be broken deterministically (by user_id or created_at), or should ties cause fewer than 10 rows? Often product intent determines the right approach.
- Use window functions to control ranking behavior and tie-break explicitly.
Example SQL patterns:
If ties should be broken by a secondary column (e.g., user_id or timestamp):
SELECT FROM ( SELECT , ROW_NUMBER() OVER (ORDER BY score DESC, user_id ASC) AS rn FROM oculus_scores ) t WHERE rn <= 10;
If you want to include all tied users at the cutoff (i.e., return more than 10 when there are ties):
SELECT FROM ( SELECT , RANK() OVER (ORDER BY score DESC) AS rnk FROM oculus_scores ) t WHERE rnk <= 10;
Notes on functions:
- ROW_NUMBER() assigns a unique number to each row — breaks ties deterministically when you add secondary keys.
- RANK() gives the same rank to tied values and can skip numbers after ties (useful if you want to include all tied scores at a cutoff).
- DENSE_RANK() is like RANK() but doesn’t skip ranks after ties.
Always explain your choice and the product implication (e.g., fairness, reproducibility, expected output size).
Analytics / AE: defining metrics from a comment distribution
This round focused on metric thinking more than raw SQL. They gave a user comment distribution and asked how to define metrics that capture health and engagement.
Good metrics to consider:
- Volume metrics: total comments, comments per user (mean), median comments per user
- Distribution measures: percentiles (p25, p50, p75, p90), histogram / buckets, Gini coefficient for inequality
- Engagement/quality metrics: percent of active users leaving ≥1 comment, comments per DAU/MAU, comment-to-view ratio
- Temporal metrics: week-over-week change, cohort retention of commenters
- Outlier handling: cap extreme commenters, use log transforms for heavy-tailed distributions
Guidance on answering:
- Start with the business question: Are we measuring engagement, content health, or moderation load?
- Propose a small set of primary metrics (1–3) and supportive diagnostics (distribution, percentiles, and segmentation).
- Discuss segmentation: new vs. returning users, device/region, group type (Circle vs Group), post type.
- Talk about statistical robustness: sample size, confidence intervals, and how to handle skewed distributions.
Product questions: Circles / Facebook Groups
Expect open-ended, hypothesis-driven questions. Examples they might expect you to cover:
- How to measure growth and engagement of a new Circle feature
- What success metrics would indicate healthy group interaction versus spammy or toxic activity
- How to A/B test a change that affects commenting behavior (metrics, guardrails, duration, and segmentation)
Frame answers with a hypothesis -> metric -> guardrail -> experiment plan approach.
How this differs from Amazon-style screens
From my experience: Amazon screens often focus on writing correct SQL and algorithmic correctness. Meta emphasizes metric design, product-sense, and careful handling of real-world data quirks early in the loop.
HR experience
- HR communication was clear and professional.
- They provided a timeline and helpful prep guidance — which made logistics and expectations easier.
Key takeaways & prep checklist
- Practice window functions (ROW_NUMBER, RANK, DENSE_RANK) and know when to use each.
- Practice designing metrics from distributions: be ready to justify primary metric choices and supportive diagnostics.
- Always ask clarifying questions about business intent before coding.
- Be explicit about tie-breaking or inclusion rules for cutoffs.
- Prepare product-sense answers (hypothesis → metric → guardrails → experiment).
- Practice communicating trade-offs and assumptions clearly.
Quick resources
- Brush up on SQL window functions and ranking behavior
- Review percentile/quantile calculations and how to compute them in SQL
- Study A/B testing basics: metrics, power, guardrails
Good luck if you’re interviewing — the loop rewards practical, metric-driven thinking and clear communication.
#DataScience #SQL #InterviewPrep

