Data Interview Case: Conversion Drop — Diagnose It Like a Pro
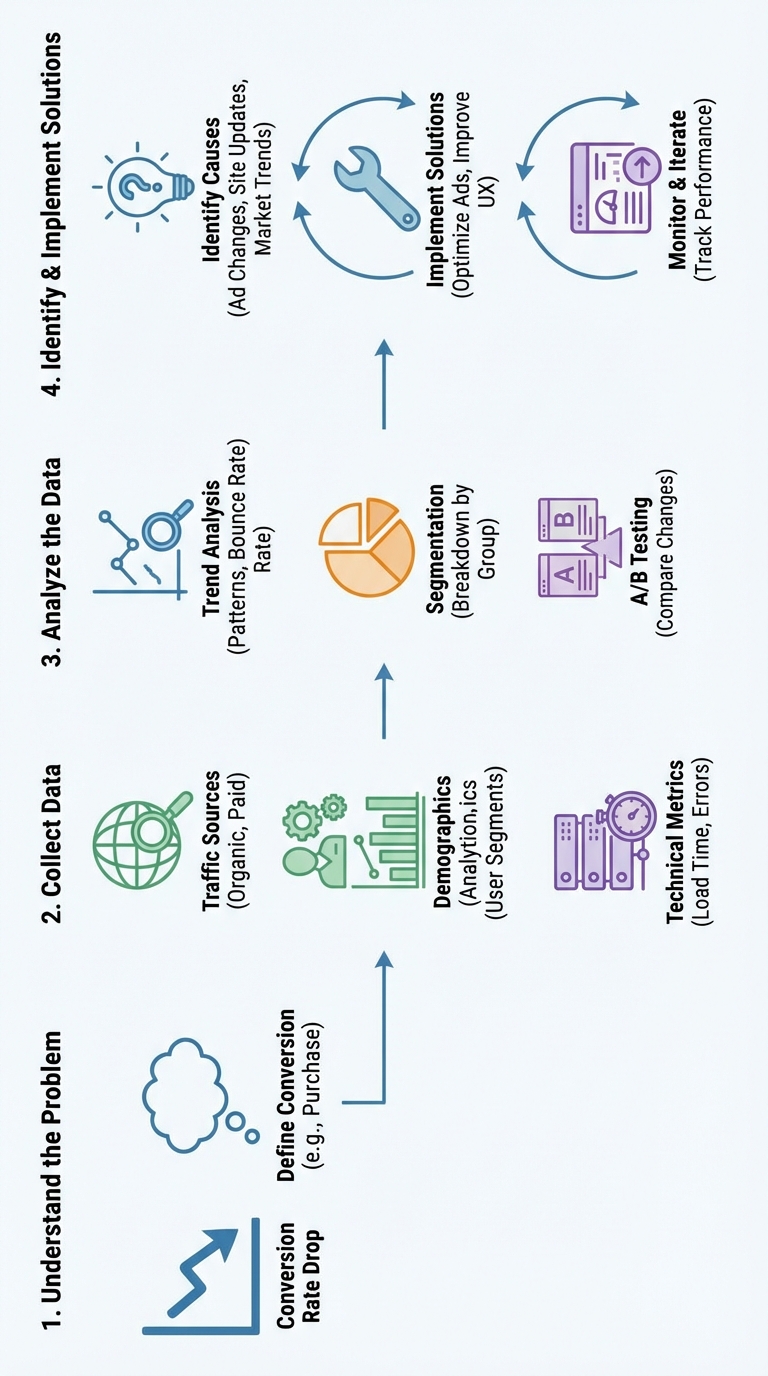
TL;DR — Interviewers often ask: “Conversions dropped 20% — what do you do?” Answer with a concise, structured troubleshooting framework: define the metric, find when it started, gather data (traffic, behavior, technical), run prioritized checks, form hypotheses, validate, fix, and monitor.
1) Start with a crisp definition
- Which conversion? (checkout completed, signup, trial start, add-to-cart → purchase)
- Numerator and denominator (e.g., purchases / sessions or purchases / users)
- Granularity: overall, by country, by device, by channel, by user cohort
Example statement you can lead with in an interview: "I’ll define conversion as X (purchases / sessions), determine the exact start date of the drop, and run a prioritized set of checks across tracking, traffic, UX, and backend health."
2) Pinpoint timing and scope
- When did the drop begin? (specific timestamp or day)
- Sudden vs. gradual
- Global vs. region/device/channel-specific
- Only new users or also returning users
Why this matters: A single deploy or campaign change at the same timestamp is a strong signal.
3) Collect the essential data quickly
- Traffic: sessions, users, new vs returning, by channel/source
- Funnel events: page views → add-to-cart → checkout → purchase
- Engagement: bounce rate, time on page, pages per session
- Technical metrics: page load times, error rates, API latency, 5xx responses
- Experiment flags / recent releases / campaign changes
- Demographics and device breakdown
- Qualitative: session recordings, surveys, support tickets
Prioritize datasets that are quick to query and most likely to show a root cause (traffic sources, landing page performance, deployment logs).
4) Quick health checks (first 10–30 minutes)
- Verify tracking: did analytics or event pipelines fail? (missing events or doubled events)
- Check A/B tests or feature flags: was a variant rolled out?
- Look at deployments/releases around the start time
- Inspect paid spend: did CPC/Impressions drop or targeting change?
- Check recent tag manager changes or CDN issues
If tracking is broken, all downstream analysis can be misleading — call this out immediately.
5) Quantitative analysis — prioritized queries & segments
Focus analysis by channel, device, landing page, and user cohort.
Sample SQL to get conversion rate by traffic source (adjust table/column names):
SELECT
  traffic_source,
  COUNT(DISTINCT session_id) AS sessions,
  SUM(CASE WHEN converted = 1 THEN 1 ELSE 0 END) AS conversions,
  SUM(CASE WHEN converted = 1 THEN 1 ELSE 0 END)::FLOAT / COUNT(DISTINCT session_id) AS conv_rate
FROM events
WHERE event_date BETWEEN '{{start_date}}' AND '{{end_date}}'
GROUP BY traffic_source
ORDER BY conv_rate DESC;
Useful analyses:
- Trend: total traffic vs conversion rate over time
- Conversion by channel (organic, paid, email, social)
- Conversion by landing page or campaign ID
- New users vs returning users conversion curves
- Funnel drop-off points (where in the funnel did drop increase?)
- Cohort analysis: did a particular acquisition cohort convert worse?
6) Typical causal patterns (and what they imply)
- Paid traffic down + overall conversions down: check ad spend, budget, campaign targeting
- New-user conversion down while returning stable: landing page, acquisition creatives, tracking on first-visit flows
- Mobile conversion down: mobile-specific UX or recent mobile release
- All channels down simultaneously: backend outage, payment provider issue, tracking bug
- Sudden spike in bounce rate: landing page loading errors, broken JS, 500 responses, or wrong ad-targeting
7) Hypothesis, validate, and iterate
- Form 1–3 prioritized hypotheses (e.g., “A recent landing-page change increased bounce for paid visitors.”)
- Validate with data: segment by users who saw the new landing page; check heatmaps/session replays
- If you shipped changes, run quick A/B checks: compare users routed to old vs new experience
- If an A/B test exists, check for imbalance/feature flag override
Validation methods:
- Backfill conversion by experiment variant
- Rollback a change (if safe) or pause new campaign targeting
- Run quick cohort comparisons (pre/post or variant vs control)
8) Remediation steps (examples)
- If paid acquisition fell: contact ads team, re-evaluate bids, check tracking and UTM parameters, pause underperforming creatives
- If landing page UX is the issue: fix layout, reduce load time, remove blocking JS, restore previous variant if available
- If tracking broken: fix analytics pipeline and reprocess if possible; annotate data and communicate limitations
- If backend/payment failures: escalate to SRE, add retries/fallbacks, monitor queue/backlog
After fixes: monitor the conversion metric and leading indicators (bounce, session time) continuously.
9) Monitoring & post-mortem
- Create or update dashboards with alerts for sudden relative drops (e.g., >10% vs rolling baseline)
- Add synthetic checks for critical pages (availability and response time)
- Document the root cause, timeline, mitigation, and preventive actions
10) Interview-ready answer template (concise)
- Clarify definition: "Which conversion metric are we measuring?"
- Scope: "Is the drop sudden or gradual, and when did it start?"
- Quick checks: "I’ll first verify tracking, releases, experiments, and ad spend."
- Deeper analysis: "Segment by channel, device, landing page, and new vs returning users; inspect funnel at each step."
- Hypotheses & validation: "Form top hypotheses, validate with A/B or cohort comparisons, and rollback if needed."
- Fix & monitor: "Implement targeted fixes, then monitor leading indicators and set alerts."
Quick checklist (for interview or real work)
- [ ] Define metric precisely
- [ ] Determine start timestamp and affected segments
- [ ] Verify analytics/tracking integrity
- [ ] Check recent deployments & feature flags
- [ ] Analyze by channel/device/landing page
- [ ] Form hypotheses and validate with experiments/cohorts
- [ ] Implement fixes, monitor, and document
Common one-liner conclusion you can use in interviews: "Start by defining the conversion and the time window, verify tracking and recent releases, segment traffic by channel and user type to localize the problem, form 1–3 hypotheses, validate with experiments or cohort comparisons, then fix, monitor, and document."
Tags: #DataScience #Analytics #ProductAnalytics #ABTesting #SQL #InterviewPrep #DataEngineering
About the author
bugfree.ai is an advanced AI-powered platform designed to help software engineers master system design and behavioral interviews. Whether you’re preparing for your first interview or aiming to elevate your skills, bugfree.ai provides a robust toolkit tailored to your needs. Key Features:
150+ system design questions: Master challenges across all difficulty levels and problem types, including 30+ object-oriented design and 20+ machine learning design problems. Targeted practice: Sharpen your skills with focused exercises tailored to real-world interview scenarios. In-depth feedback: Get instant, detailed evaluations to refine your approach and level up your solutions. Expert guidance: Dive deep into walkthroughs of all system design solutions like design Twitter, TinyURL, and task schedulers. Learning materials: Access comprehensive guides, cheat sheets, and tutorials to deepen your understanding of system design concepts, from beginner to advanced. AI-powered mock interview: Practice in a realistic interview setting with AI-driven feedback to identify your strengths and areas for improvement.
bugfree.ai goes beyond traditional interview prep tools by combining a vast question library, detailed feedback, and interactive AI simulations. It’s the perfect platform to build confidence, hone your skills, and stand out in today’s competitive job market. Suitable for:
New graduates looking to crack their first system design interview. Experienced engineers seeking advanced practice and fine-tuning of skills. Career changers transitioning into technical roles with a need for structured learning and preparation.
Comments
Join the discussionNo comments yet. Be the first to comment.