
Dashboard Interview Questions: Build Less, Explain More

bugfree.ai is an advanced AI-powered platform designed to help software engineers master system design and behavioral interviews. Whether you’re preparing for your first interview or aiming to elevate your skills, bugfree.ai provides a robust toolkit tailored to your needs. Key Features:
150+ system design questions: Master challenges across all difficulty levels and problem types, including 30+ object-oriented design and 20+ machine learning design problems. Targeted practice: Sharpen your skills with focused exercises tailored to real-world interview scenarios. In-depth feedback: Get instant, detailed evaluations to refine your approach and level up your solutions. Expert guidance: Dive deep into walkthroughs of all system design solutions like design Twitter, TinyURL, and task schedulers. Learning materials: Access comprehensive guides, cheat sheets, and tutorials to deepen your understanding of system design concepts, from beginner to advanced. AI-powered mock interview: Practice in a realistic interview setting with AI-driven feedback to identify your strengths and areas for improvement.
bugfree.ai goes beyond traditional interview prep tools by combining a vast question library, detailed feedback, and interactive AI simulations. It’s the perfect platform to build confidence, hone your skills, and stand out in today’s competitive job market. Suitable for:
New graduates looking to crack their first system design interview. Experienced engineers seeking advanced practice and fine-tuning of skills. Career changers transitioning into technical roles with a need for structured learning and preparation.
Dashboard Interview Questions: Build Less, Explain More
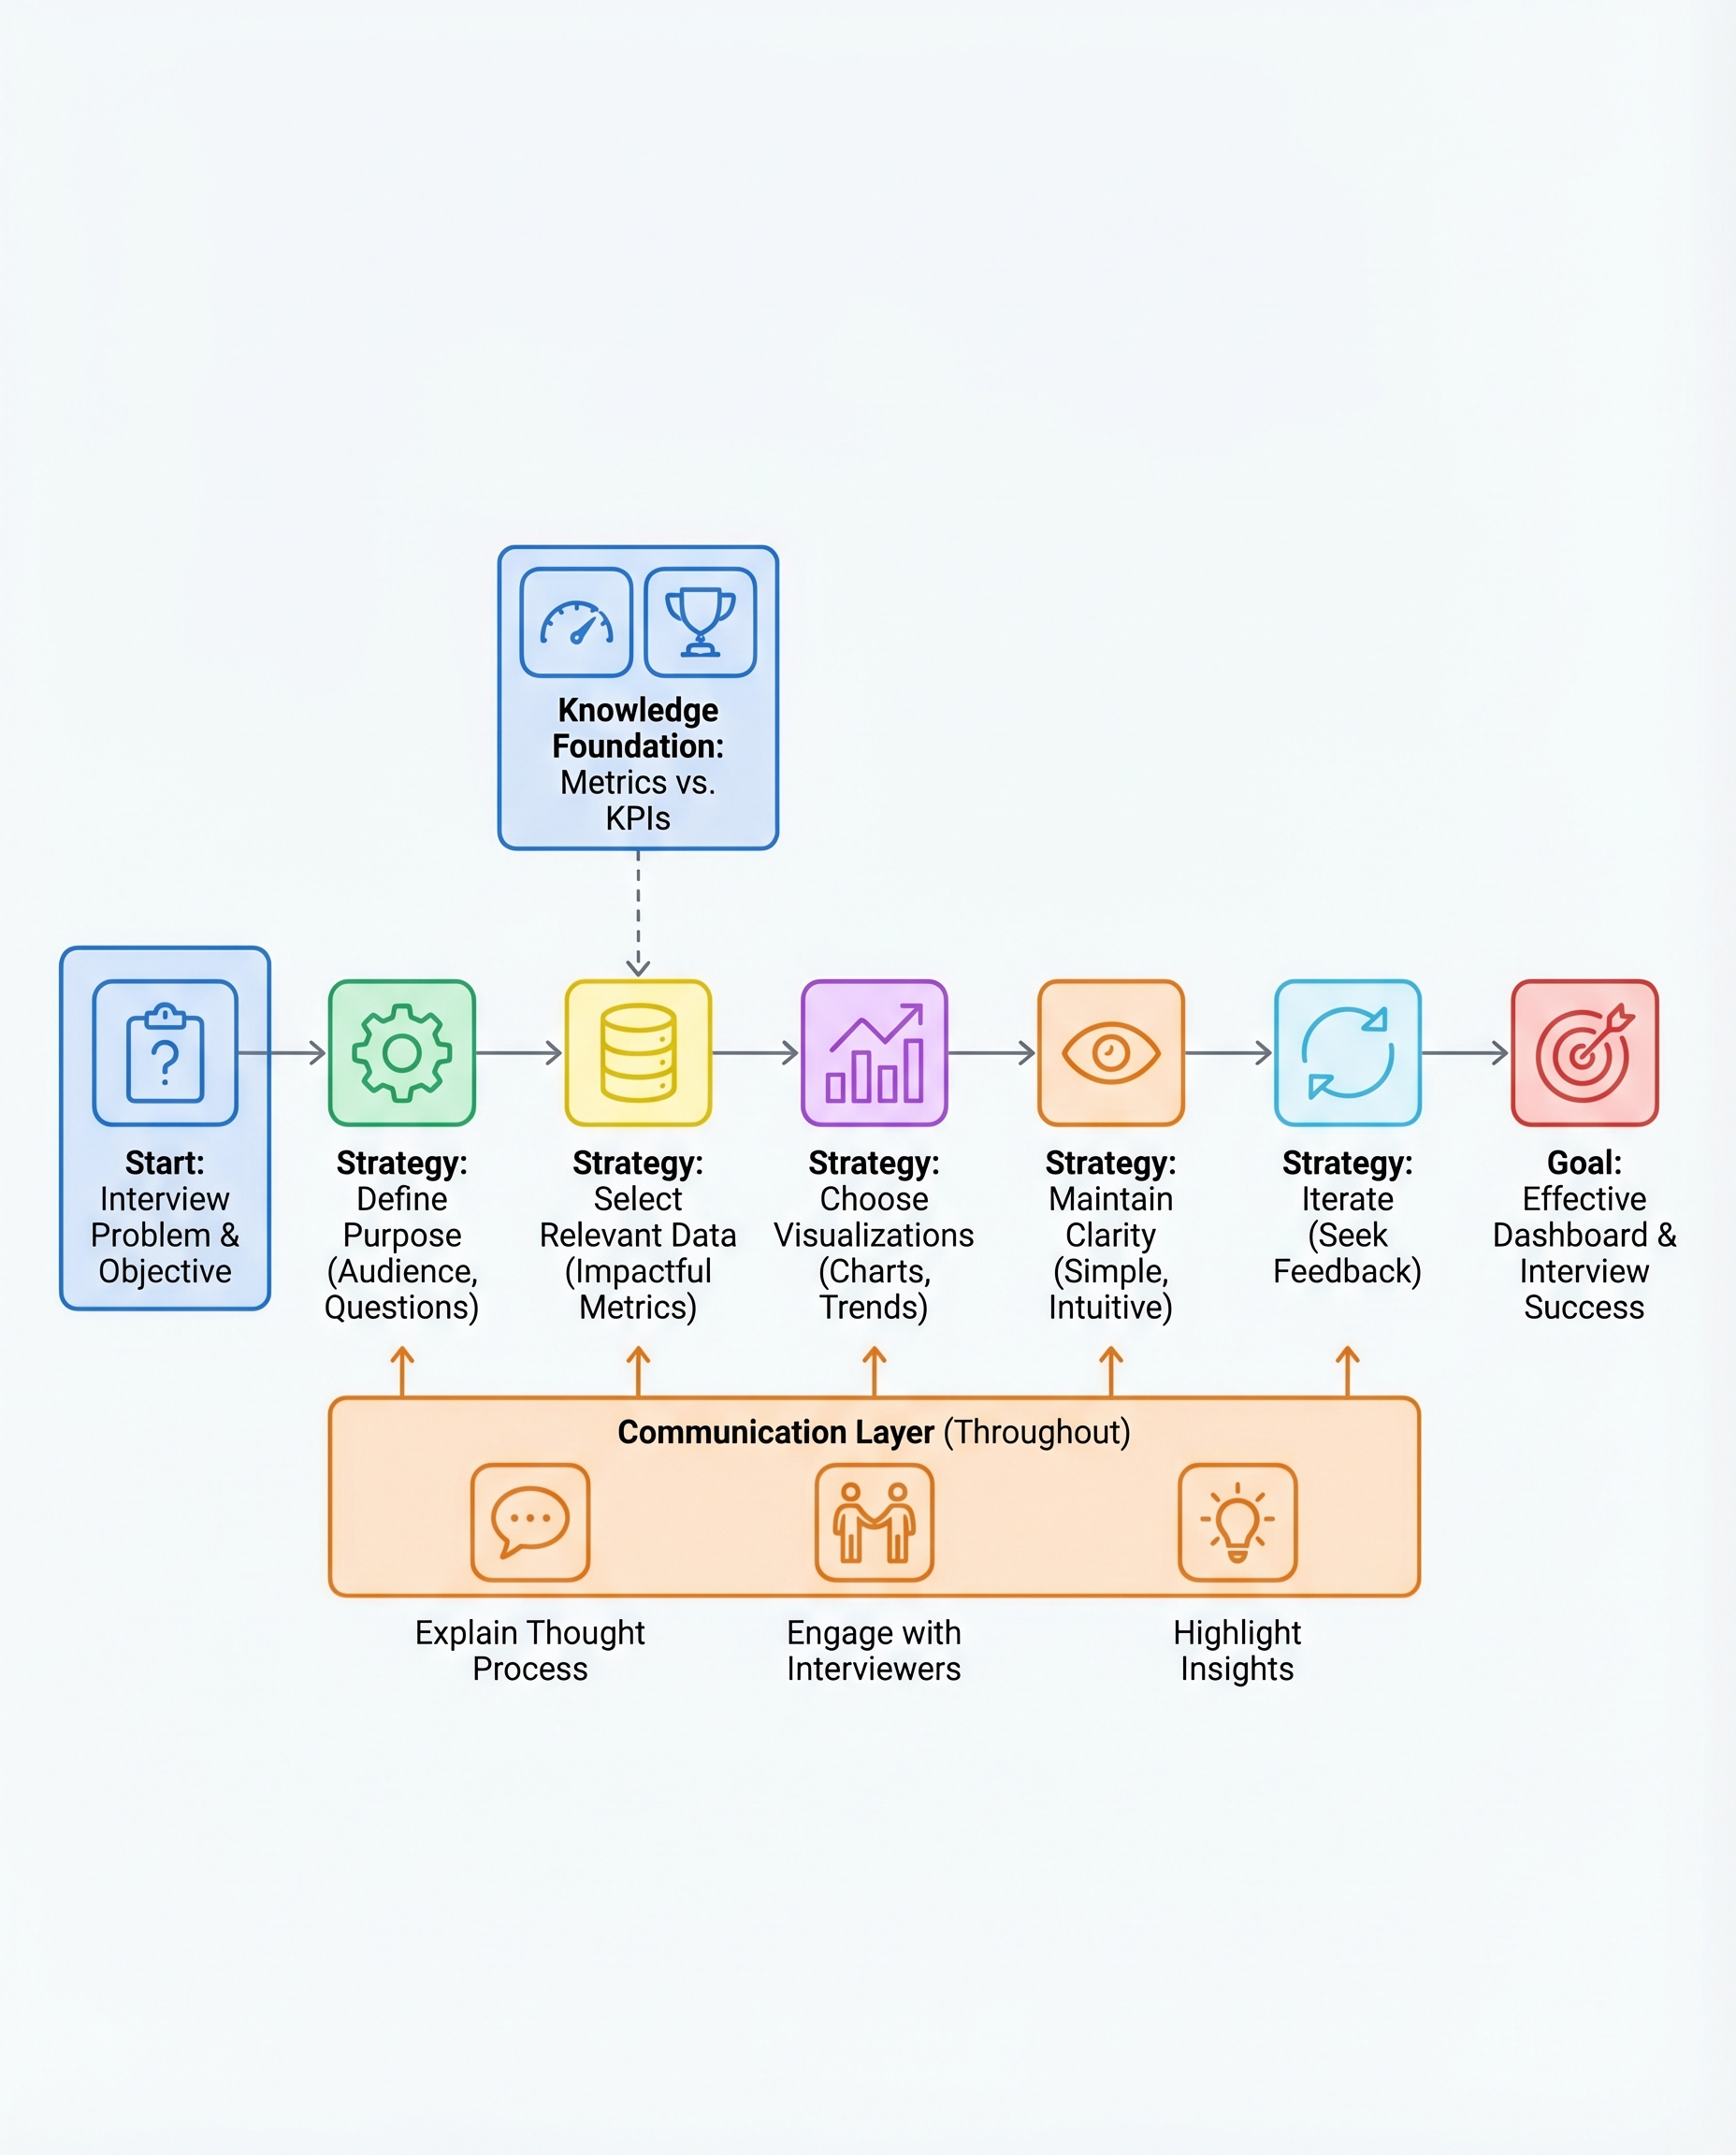
In dashboard interviews, the goal isn't to impress with many charts—it's to show you can drive decisions. Interviewers want to see product sense, communication, and judgment. Build deliberately, explain clearly, and use visuals only to support an insight.
Below is a compact, practical approach you can use in any dashboard exercise or whiteboard interview.
1) Define the purpose
- Ask: What question are we answering? Who will act on this? (e.g., product manager vs. executive).
- Clarify the time window, segment, and required granularity before you start building.
- Example prompt to interviewer: "Is the priority monitoring growth, retention, or a specific funnel drop-off?"
2) Pick only the metrics that matter
- Start broad, then narrow to KPIs—the critical subset that answers the question.
- Prefer rate or ratio metrics (conversion rate, retention rate, revenue per user) over raw counts when they’re more actionable.
- Example: For onboarding health, show new users, activation rate, and 7-day retention—not daily signup counts for every channel.
3) Match visuals to intent
- Choose chart types that make the comparison obvious:
- Bars = compare categories (sales by region)
- Lines = trend over time (revenue growth)
- Area = cumulative or relative magnitude over time
- Pie/donut = composition only when parts sum to a meaningful whole (use sparingly)
- Use tables for precise values and charts for pattern recognition.
4) Keep it simple
- Clear labels, readable legends, consistent colors, and minimal gridlines.
- Highlight the one number or trend you want the listener to take away (bold, color accent, annotation).
- Avoid 3D effects, excessive filters, or more than 4–6 colors.
5) Iterate and show how you handle feedback
- If asked to change something, narrate why you’d adjust it and what the expected decision outcome would be.
- Iteration is part of the test: interviewers are evaluating your prioritization and responsiveness to new constraints.
How to narrate your thinking
- Lead with the insight, then show the evidence.
- Wrong: "Here’s the dashboard." (silent build)
- Better: "Insight: activation dropped 8% last week; evidence: the green line shows a decline in Day-1 activation after the release. Next step: investigate the onboarding flow that shipped last Wednesday."
- Use a concise script: 1) question & audience, 2) chosen KPIs, 3) top insight, 4) recommended next step.
Quick checklist for interviews
- Ask clarifying questions first
- Limit to 3–5 visuals and 2–4 KPIs
- Pick the simplest effective chart for each metric
- Call out the single insight per chart
- Suggest the next action or analysis
Final note
Quality beats quantity. A clean, well-justified dashboard plus a clear narrative shows you can drive decisions—exactly what interviewers are assessing.
#DataScience #Analytics #InterviewPrep

